Thursday, July 16, 2020

Natural Gas Early Entry Long - Exit


Early morning I added an Inverted Head & Shoulders to the chart in yellow. Since we already broke through it, and now we're retesting the neckline, this is a bullish indicator. But ...

We climbed up to the 34ema and rejected off. When price action started looking weak, I moved my Stop Loss to break even at 1.745 and it was hit 12:12pm ET.

We made a new low in this down leg today and closed under the 8ema. At this point I wouldn't want to be long or short. So, this was a very short trade but thankful to be out without a loss.

Just have to watch it for a good signal one way or the other.

Wednesday, July 15, 2020

Natural Gas Early Entry Long


August Natural Gas bottomed on the daily chart 6/25/30 - 6/29/20 with a Morning Star on low stochastics and heavy volume. Then it made 2 legs higher, each followed by a pull back. Now the 2nd pull back looks like it bottomed today (7/15/20). Here's what I see:

Morning Star like candle pattern.
Bounce off the 20sma.
Bounced off the 78.6% Fibonacci of the light blue range (1.924-1.655).
Close over the 8ema.
Stochastics aren't as low as we'd like but still has plenty of room to run.
We rejected off resistance at the 50sma at 1.924. Since we already paid tribute to it then, odds are better we can break through it now.

All those things are bullish, but we still have to get through the 34ema, 50sma, and the previous swing high to reach our target. The target is 1.982 which is the measured move of the past 2 up legs (see the bold white angled line). This also coincides with 50% Fib retrace of the purple range (1.517-2.447).

Anticipating the pattern, which is not a prudent practice, and not waiting for confirmation from further up move tomorrow, which is worse than imprudent, I entered early at 1.745. This was clearly a failure of self-discipline. This kind of failure has cost me losses in the past. Its something I'm still working on. I've read in many places Traders tend to make the same mistakes many times before they master them. Here's an example. It's caused by greed. One of the two big profit killers. The other is fear. Impatience is another killer but easier to deal with than fear and greed.

I used the mini-contract (symbol QG on IB TWS). The full NG contract is $10,000 per 1.000 point while the QG contract is $2,500 per 1.000 point.

I have a Stop Loss at 1.700, just below the recent swing low.

Risk=1.745-1.700=.045*$2,500=$112.50
Reward=1.982-1.745=0.237*$2,500=$592.50
R:R=112.50/592.50=1:5 which is rarely excellent. (Helped by entering early.)

Saturday, July 4, 2020

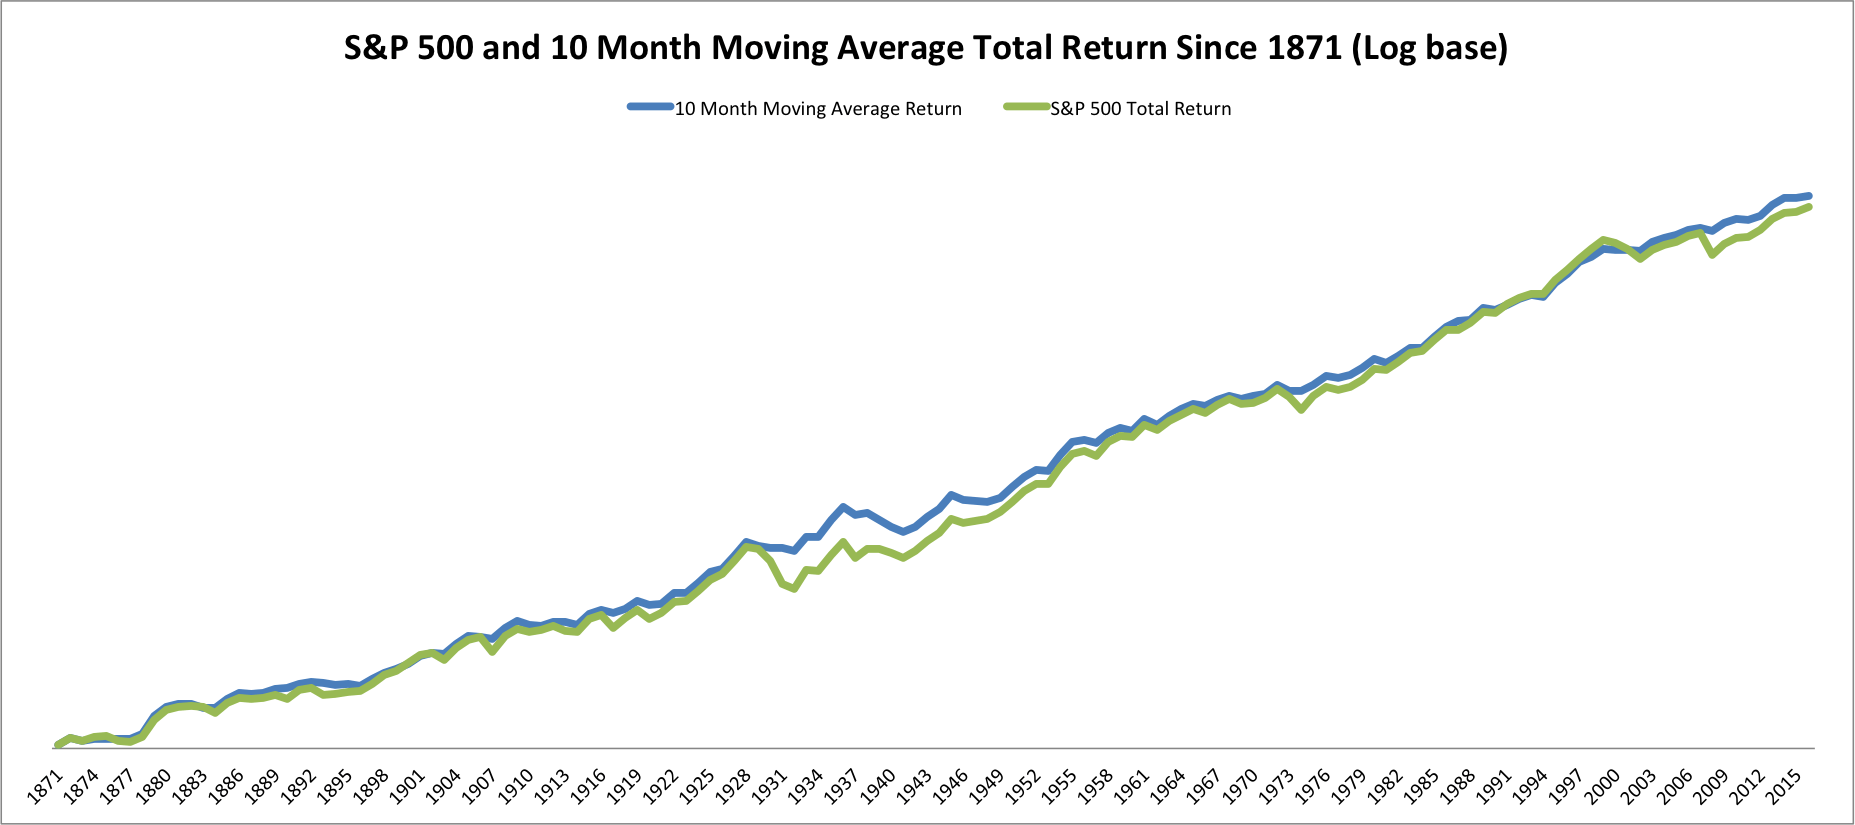
You're losing value even if your portfolio is going up


Let's say inflation is 10%/year and you have $1,000 today in cash, then in one year today's $1,000 will be worth 1,000 - (1,000 x 10%) = $900.

Let's say you have 100 shares of stock worth $100,000 today (so each share is $1,000) and in one year it goes up 10% and is reinvested. Then in one year your 100 shares will become 110 shares.

But in one year how much real value do you have in stocks? 110 shares x $900/share = $99,000. So your $100,000 in stocks became $99,000 even though your stock portfolio increased by 10%.

This is an illustration of why you need to consider "purchasing power" of your dollars. Not just the nominal value of your account statement.

I used "inflation" in the example, but you could easily replace it with "devaluation" or "diluted value" due to the Federal Reserve's inflation of the money supply by adding trillions of dollars. 1 trillion is 1,000 billion.

And this doesn't even consider the artificial nature of the stocks rising due to share buy back plans and other transient stimulants.

The point I'm trying to convey is to find a way to protect your purchasing power. I have no financial credentials, and you need advice you can trust, so it would be worth your time to ask about this with your trusted financial advisor.

https://seekingalpha.com/article/4336860-long-term-stock-market-timing-since-1871


Falling Purchasing Power


Thursday, July 2, 2020

Dec Corn Big Bullish News - Exit


This morning 8:11am ET I Tweeted:

"Moved up the Stop Loss on Dec #Corn #Futures to 358 3/4, just under the overnight trading, because we came very near the 50% Fib on very overbought stochastics, and far above the 3ema."

It was hit 9:30am ET at the open. Exited at 358 1/8. The chart above was captured 12:55pm ET. The Tweet and yesterday's blog post explains why.

I expect we'll have some counter-trend downward price action for a few days then resume the trend back up. When a bullish setup appears I intend to re-enter this trade to the long side with the same target. If things look promising enough we'll probably go back to the full futures contract.

Profit 358 1/8 - 350 3/4 = 7.375 * $10/pt = $73.75

Guess we have to count this trade as a win. If we used the full ZC contract, profit would have been 7.375 * $50 = $368.75.


Wednesday, July 1, 2020

Dec Corn Big Bullish News - Update 1


Solid performance today. However, we have 3 big candles in a row now, we're well over the 3ema, the candle closed well over the upper Bollinger Band, and stochastics are now oversold. So, the odds seem pretty high we're due for a pull back.

We only need 1 more candle about the size the last 3 to hit our target, but trading seldom goes so smoothly. In my experience, we'll have to endure a few days of a pull back and recovery. If so, I'll probably take that as an opportunity to increase our position. But if I had a choice, I'd prefer we just have another good day and hit our target before the upcoming 3 day weekend.