Friday, July 28, 2017

XBI Wedge Breakout Exit


Chart above was captured around 11:40am ET. But at the open price gapped down then continued a little further down before reversing. Before it reversed it looked like confirmation after yesterday's large bearish engulfing pattern with a close below the 8ema. I had to get out. Sold for $2.10 per option which was a loss of $1.10.

Now I'll see how it closes for the day. Only a close above yesterday's high would be a bullish sign for today. If it closes above the 8ema but below yesterday's high, that's not a valid candlestick signal. But over a longer period, we may be forming a cup and handle pattern which would be bullish.

If it closes today under the 8ema I should probably enter short but I'd rather just watch for another day. Sorry this didn't work out. At least we contained our loss and followed our rules, which I understand is the definition of good trading.

Wednesday, July 26, 2017

XBI Wedge Breakout Update 2


7/26/17 9:40 you can see there was a retracement yesterday but I stayed in the trade because even though there was a bearish engulfing candle, we closed above the 8 ema. So there was no confirmation, at least the way I trade.

Monday, July 24, 2017

Wednesday, July 19, 2017

XBI Wedge Breakout


Strong up move end of June followed by consolidation manifested as a wedge (triangle). 7/13/17 price broke out, then retraced to test the top of the wedge. Then today 7/19/17 we had a gap open after a doji yesterday. I love a break out followed by a retest and confirmation. That's what we have here, so I want to trade it.

Got Sep 80 Calls for $3.20. You can see in the chart above the daily candle went up and came back down to just below the open. This doesn't bother me. In fact, I'm ok with completely closing the gap, and even all the way back to the top of the triangle. The message is the same. As long as price doesn't close below the bottom of the triangle, I'll hold. My risk is limited to the cost of the options.

Friday, July 14, 2017

Bullish BIIB Trade Exit


This Jhook didn't form cleanly. On 7/6/17 it took a dip back down. This introduced doubt but I gave it a chance while I watched it closely. Then it started back up.

When the trade went positive I moved my stop up because of the imperfect Jhook and we're only a week away from expiration. It may just go sideways for a week. Still looks good, but you have to remember to keep your losses small.

On 7/13/17 14:58 ET the stop was hit and I got out with a small profit. Today, 7/14/17, its looking like it could continue higher, but I'm satisfied with how I handled the trade. I'd rather be out wishing I was in than in and wishing I was out.

If there was a lesson for me here, its that I chose to close a month. I chose July because it had better liquidity and I thought the target would be hit quickly, plus the cost was lower which meant less money at risk.

Monday, July 10, 2017

Bullish BIIB Trade Update


I'm still in this trade but we haven't been moving as expected. Getting out of the trade and monitoring it would be the prudent thing to do, but we're hugging the 200sma and the 8ema. The 20sma is rising up to meet price and  might supply support in a day or two. Plus a Full Moon cycle starts today which has a bullish tendency on stocks. If we close below the previous swing low I'll exit, otherwise I'll stay in a little longer.

Wednesday, July 5, 2017

BIIB J-hook Looking Bullish


BIIB made a strong vertical move from 6/19/17 to 6/22/17 then made close to a 50% retracement while not being able to close below the 8ema. Today, 7/5/17 it had a small gap up open after a doji. At 11:30am its looking strong and beginning to form a J-hook. Stochastics are not overbought yet. Volume is down and could be ready for a resurgence during an up leg. You can also see an inverted head and shoulders pattern with a low on 5/31/17. Plus price is above all my Moving Averages at the moment.

The thick down sloping white line is a resistance line on the weekly as you can see below. This is a potential target.

The thick white vertical line is a measured move equal to the previous up move from 6/19/17 to 6/22/17. The thin white horizontal line segment is the halfway point on the measured move. This is another potential target, and very close to the previous top on 6/23/17. This is the most conservative target.

The 127.2% Fibonacci extension is another good target at 293.26 on my chart.


If it continues up and moves as fast as the last leg, we only need a week or two to hit our target. So, to reduce cost, and increase Gamma, and mitigate the Theta time decay, I used a July 21 280/290 Vertical Call Spread. Got in at $2.75 using a limit order at the midpoint between the option spread bid and ask. This is a potential 1000:275 reward:risk, or about 3.5:1 which is good.

It will be important to close the day today above the open. If we close under the 8ema and continue down tomorrow, I should get right out and watch for a quick up move where I can get back in.

To see how my chart is set up, check out this posting:

http://jmstweets.blogspot.com/2015/04/my-standard-chart-indicators.html

Wednesday, May 3, 2017

XLV Looking Healthy - Exit


Sold the Calls for .95, so other than commission its exactly a breakeven.


Exited because we're close to the halfway point of the measured move (see horizontal white line segment, and today we had the first gap down open in 10 days, and stochastics are very high and rolling over a bit.

Wednesday, April 26, 2017

XLV Looking Healthy


I'll explain why I'm bullish, but first let me tell you how I acted on it. I got some June 76 Calls for $.95 each when XLV was $75.36. Target is the 127.2% Fib at 78.84 but I entered my conditional sell order at 78.80 to be a little conservative. This option currently has a Delta of about 43% and Gamma of .13. That will rise as the underlying rises about $.13 for every dollar move of the underlying. So at the target the Delta should be about 78.84-75.36=3 x .13=.39 + .43 = .82. If we average the Delta's that's (43%+82%)/2 = 62.5%. So the value of the option is roughly ($3 x 62.5%) +  .95 = $2.83. That gives us a Risk:Reward of .95/2.83 = approximately 1:3.

Here's what I see that makes me bullish:

Jhook: strong move from 1/31/17 to 3/15/17 followed by profit taking and now a resurgence.

Double Doji Kicker: 3 days ago we had a down candle then a gap up to a doji and another gap up to a doji and today looks like a green candle, but the day is not over. I really should have waited until we were close to the close. If we close with a nice green bar then we have the pattern we want. Otherwise I may exit back out.

Close above all Moving Averages: Yesterday's close was above all the moving averages I have on the chart and today gapped up again and is moving higher.

The Bollinger Bands are breaking out of the Keltner Channel to the upside. This often means a strong continuation pattern will follow.

The Ichimoku Kinko Hyo (I nicknamed it Ichi) chart looks great. Price is breaking out of the cloud and the trailing line is breaking through price. Here's the Ichi chart:


Of course news could derail this whole trade and I'll have to exit, but I limited my risk to the cost of the options and I took a position less than 2% of my account.

(All my chart indicators are defined in "My standard chart indicators" posted 4/8/2015)

Tuesday, April 11, 2017

XHB Hedged Bear Trade Exit


We haven't hit my stop or even broken the trend line, but 4/5/17 & 4/6/17 form a Bullish Harami then 4/6/17 - 4/10/17 form a Doji Sandwich, both are bullish. Plus we have a close above the 8ema yesterday which is a change of trend indication. Today we seem to be moving higher which could be confirmation if we close positive.

So, while we could wait for a close above the trend line, I'm going to be conservative and exit here today with a small loss.

Results:
Shorted XHB 36.82, covered 37.07.
Bought XHB May 38 Calls for .36, sold for .36.

Goal is small losses and larger gains.

(All my chart indicators are defined in "My standard chart indicators" posted 4/8/2015)

Thursday, April 6, 2017

XHB Hedged Bear Trade Update 1


Almost 10:30am 4/6/17 seeing a green candle forming a Bullish Harami candle pattern. This could lead to the formation of a wedge. If it does I'll need to close the trade because I didn't enter the trade for a wedge.

Currently still under the 8ema. I'll give it to the end of the day and see how it looks.

Tuesday, April 4, 2017

XHB Hedged Bear Trade


Notice the lower high on 4/3/17 (yesterday) and a gap down today. Yesterday also was a bearish engulfing candle and a close below the 8ema. These are bearish signs.

I expect the 2 most likely moves from here are either the formation of a wedge, which is not my preference, or a continued drop to the trend line I drew, which coincides with the 50SMA and the 50% Fib. The latter would form a down channel, and this possibility is what I'll trade on.

Where would I be wrong? If price exceeds the previous swing high of yesterday at  37.41. So I put my stop at 37.50. Also, in case of a crazy gap up move, a stop won't help me. So I got May 38 Call options for $.36 and shorted XHB shares at $36.82 in equal proportions to the number of shares represented by the options (100 shares per option). I set my target just above the 50% Fib at $36.04.

So, worst case win is 36.82-36.04 =$.78-.36(option)=$.42/share. But the option will probably not be worthless, so I'll make more.

If the trade stops out, then the loss is 36.82-37.50=.68 but the option will gain .68x30%=.20 because the option has a 30% Delta. So the loss is .68-.20=.48 per share. But the Delta will increase due to Gamma so I'll lose a little less.

This is pretty close to a 1:1 risk:reward. Not desirable but I think the probabilities of a stop out is much less than a down channel forming, so I'll put the trade on for a 1:1 risk:reward because I think I have an edge, at least until the 50% Fib is hit.

Worst case loss is if there's a huge pop and price goes over $38. In that case my loss is capped by the 38 Call option to 36.82-38.00-.36(option cost)=$1.54 per share. Not good, but it is defined and I will use this when calculating the size of my position to no more than 2% of my account.

OK, let's see what happens.

Wednesday, March 1, 2017

YM Daily Fib Extension Targets


Here's the daily chart of the Emini YM Dow Jones Industrial  average March futures on March 1st 12:00pm ET. We're already well past the 127.2% Fibonacci level, so the next Fib based target is 161.8% which I have as 21,250. The next Fib target would be 200% which is 22,080.

However, we'll be changing the front month from March to June next week on March 9th. If we get more strong moves to the upside we could hit the 161.8% before then. If not, I'll just draw the Fibs on the June chart.

If we do hit the 161.8% Fib I'll be looking for a reversal pattern to short. Not saying I'm predicting one, but I'll be on the look out for one.

I've been using the 127.2% Fib as a target on YM intraday scalping trades on continuation patterns and its been working very well. It works a lot better on stronger volume than on weaker. I've been using 500 contracts/minute as a minimum for a 21 period SMA on the 1 minute volume chart. I made a rule for myself that I should only enter a trade if the current 1 minute chart volume SMA(21) is greater than or equal to 500. When I break that rule due to a beautiful pattern, I'm usually disappointed and a little poorer.

Wednesday, February 15, 2017

YM Bullish Fractals 2-13-2017 Update


Came within 2 points of my sell limit yesterday at the 127.2% Fib level, exceeded it for a substantial time overnight, then hit it again at 9:33am this morning. Because the daily stochastics are so very overbought I sold the whole position. Under other circumstances I would have sold a third, then raised my stop to break even and set a target for another third at the half measured move target and the final third at at the 161.8% Fibonacci level.

At the moment I'm glad to hit any target and be out with a profit. The fact that my first target was exceeded for a substantial time overnight then the market opened below it had me very concerned we'd just tank and not come back until after my options lose considerable value or even expire.

By the way, because my target could have been hit near the open I disabled my conditional market order to sell when YM Mar futures hit 20,498 due to the wider bid/ask spread at the open. Instead I sold the position manually by walking down limit orders from just below the ask until it was filled.

So chalk up another winner for the good guys.

Monday, February 13, 2017

YM Bullish Fractals 2-13-2017


YM March futures daily chart above shows an AB/CD pattern. You can easily see the break out from the congestion 1/24/17 - 1/25/17. That was followed by a retest of the congestion area 1/30/17 - 2/2/17. Then we resumed the CD leg to the upside.

So how far will it go? Nobody knows of course, but I'd like to identify 4 possible targets:


  1. The first target is the 127.2% Fibonacci extension level (red line) at 20500. This is 27.2% further than the AB leg. You can see the start of the Fib range at 0.0% and the end at 100.0% (green lines). This would be the most conservative target.
  2. The next target is the half way point of the measured move. See the short horizontal white line at 20682. I've noticed this area often provides resistance.
  3. The third target is the 161.8% Fib extention level (thin white line) at 21250.
  4. The last target I have for this move is the full measured move, which is at the end of the thick white vertical line at about 21750. I apologize if that is off your screen.
Now what's really interesting is what I saw when I was trading the YM Mar futures 1 minute chart this morning, right after I studied the daily chart and got some DIA March 203/207 Call spreads for $1.70 each. Check out this chart of the 1 minute:


It's a fractal! Not exact but watch this. You have an AB/CD pattern resulting in the same 4 targets but in a different order. That is:
  1. The half measured move at 20333.
  2. The 127.2% Fibonacci extension level at 20347.
  3. The full measured move at 20357.
  4. The 1.161.8% Fib extension.
On this trade, unlike the Daily setup, the congestion from B to C took the form of an ascending triangle rather than a simple channel as on the Daily.

Notice how price rose from point C and hit resistance at the half measured move level. That level was tested 2 times before it broke through on the 3rd attempt. After that price continued to meander up on low volume to the second target, the 127.2% Fib extension. I copied the chart before knowing if the other 2 targets are hit. You can check that on your 1 minute chart later. 

This struck me as a real life, real time example of the fractal nature of the markets. The trade worked on the 1 minute. If there's no big news to ruin the pattern on the daily chart, I'd expect at least the first target at 20500 to be hit. It will be fun to see what happens from here.

Monday, January 30, 2017

XLB J-hook Frypan Bottom Update 2


We opened with a gap down after a doji candle yesterday, and that was after rejecting at the 127.2% Fib on high Stochastics. That looks pretty bearish. I should hold and see if we close below the 8ema or not before exiting because we may not and then bounce back up tomorrow. However, the SPY is making an Island Reversal today (see chart below), which is very bearish.

I was going to hold, but based on the new information provided by today's price action, I decided to get out. I can always get back in. I sold the spreads for .64 each and had bought them 1/23/17 for .53, so I made $11 per spread. Remember I also made $143 on 1/26/17 on this trade. All in all it was a good trade.


XLP Scoop Pattern Update 4

Today XLP gapped down after yesterday's close below the 8ema. It may reverse and go back up, but it did just bounce off the 200SMA, which is a powerful level, and the SPY is making an Island Reversal, which is very bearish. See chart below. It would be best to get out with a very small loss at this point and see what happens. We can always get back in.

So I sold the spreads for .75 each, which is a $9 loss since I bought them for .84. I've learned the idea in trading is to take small losses and bigger gains. You can't do this if you don't take the small losses.


Friday, January 27, 2017

XLP Scoop Pattern Update 3


We have an evening star type candlestick pattern peaked right on the 200 SMA (thick white horizontal line). Then today we closed under the 8 EMA (orange line). Normally you should exit your position based on this. However, today's low touched the 200 EMA, 20 SMA, and the top of the scoop handle, then price bounced off that level a little.

So, I'm going to hold the position and see if we continue down next week or reverse back to the original upward movement from the bullish Scoop pattern.

If we do go back up, there's a good chance, in my opinion, we'll penetrate the 200 SMA. Look back to around 9/21/16. See how price came down to the 200 SMA around 9/21/16, then consolidated, then bounced off it to the upside. Then on 9/23/16, price reversed, and went down and through the 200 SMA. Then it slowly came back up to test the 200 SMA for resistance around 10/27/16 before making a nice drop to the downside. Since patterns often repeat in the market, we may do the same thing but in reverse.

Thursday, January 26, 2017

XLP Scoop Pattern Update 2


Price is up nicely since the entry. We made it past the halfway mark at "H" on the chart. Now we were rejected at resistance right at the 200 SMA. This is to be expected. The question is whether to take profits and wait for a re-entry, or hold the position. Since we're coming off the strong Scoop pattern, as explained in an earlier post, I'm going to hold on unless we close below the 8 EMA. Today you can see we closed below the 3 EMA but above the 8 EMA. I'm looking for a small pull back to "respect" the 200 SMA, never close below the 8 EMA, then resume the upward trajectory and break through the 200 SMA. Anything can happen, but that's my expectation if this trade goes well.

Another possibility is to chop around the 200 SMA for a while then take off to the upside. And another possibility is to retrace back down to the 200 EMA (thin white line that goes across the top of the Scoop handle from 12/15/16 to 1/6/17) and bounce back up. Either of these two scenarios will probably cause us to exit the position and re-enter on a resumption of the upward move.

XLB J-hook Frypan Bottom Update 1

XLB Daily


XLB 1 minute


On the daily you can see we had a nice pop right to the first target of 127.2% Fib extension. We're also well above the 8ema, which increases the probability for a pull back to the 8ema. So now I want to preserve some gains.

To tighten up my stop I went to the 1 minute chart. You can see we pulled back a little right at the 127.2% Fib extension. Coincidence? I don't know but see the dip that turned back up just above 53.10? I moved my stop to 53.10 thinking if we hit that then we're at risk of a more substantial pull back. I did that at 10:30am.

At 10:46 that stop was hit and the XLB Mar 51 Calls sold for 2.55. I had bought them 1.12 on 1/23/17. That's 128% Return on Investment in 3 days.Nice work if you can get it.

I'm holding onto the Mar 51/52 Call spreads because the 2nd target is the 161.8% Fib extension, and the spreads are a lower risk (because they cost less). If we close below the 8ema on the daily and the spreads have some value I'll sell them then. I have a standing limit order for those to sell at .90.

Monday, January 23, 2017

XLB J-hook Frypan Bottom


XLB daily chart above shows a nice move up from 11/3/16 to 12/9/16. XLB is an ETF for building materials. It may benefit if construction building picks up. Often after a strong move up, you see a pull back that looks like a cup or the bottom of a J-hook. Sometimes its a down sloping rectangle (a "flag") or a pennant.

Separately, there's a candlestick pattern that looks like a cross section of a boat with a keel in the middle. Some people say it looks like a wok for cooking Chinese food, and some people call it a fry pan bottom.

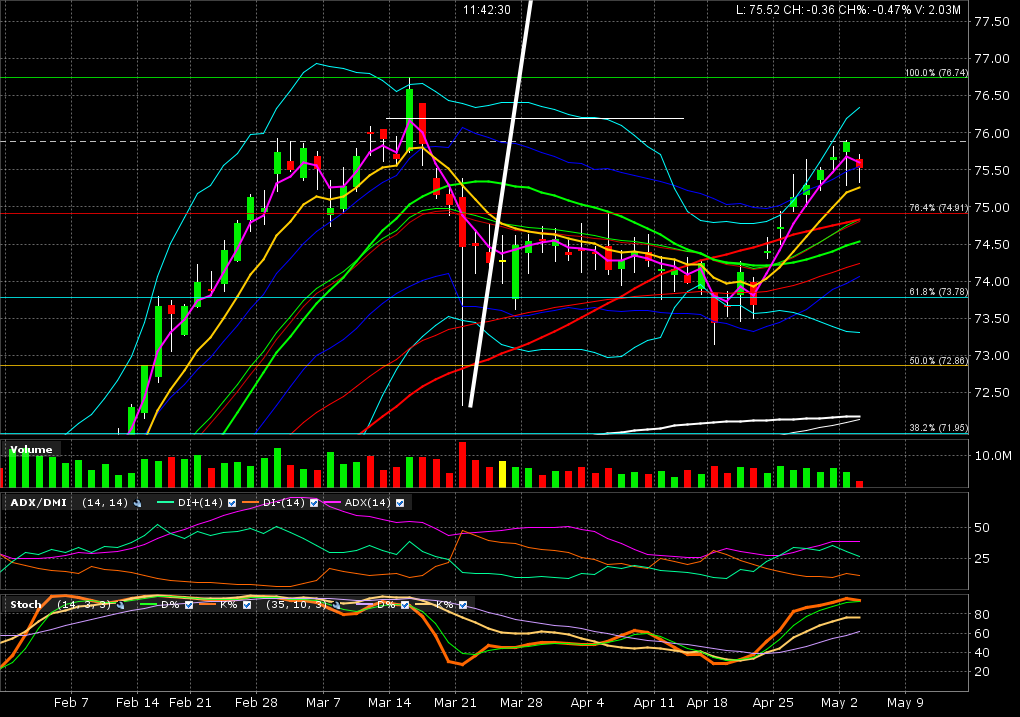
The pull back on XLB in the chart above has made a very nice fry pan bottom pattern. It even has the dimple in the middle of the bottom, which is the swing low of the pull back. I drew a thick white vertical line beginning from the swing low of the pullback on 12/30/16. This is the measured move for this trade. The top of the line is where we expect the price to go, if it makes the full move. The length of the line is the same length from the recent strong up move from 11/3/16 to 12/9/16.

The short horizontal white line at $52.32 marks the halfway mark up the measured move line. This is our first target.

Notice the 2 thick horizontal white lines going through the fry pan bottom. They are the same length. It means that the time it took to make the swing low is the same time that's elapsed from the swing low to today. Ideally, there is symmetry of time in the fry pan bottom pattern. If so, then we're about to break out to the upside.

I really shouldn't enter this trade until price has closed at a new swing high, and then continues higher the next day. So entering here is a little aggressive and more risky. So, I defined my risk by using options.

There are actually 3 targets on the chart:

  1. The halfway mark of the measured move at $52.32.
  2. The 127.2% Fibonacci extension at $53.18. 
  3. The 161.8% Fibonacci extension, which is also the full measured move at $55.10.
I looked at March 51/52 Call spreads for the first target, March 51/53 Call spreads for the second target, and just a plain March 51 Call for the third target. I entered limit orders at the midpoint of the Bid/Ask spreads and only 2 orders were filled, the simple Calls at $1.12 and the Mar 51/52 Call spreads at $0.53. That's ok.

Fry pan bottoms can be volatile when price gets back up to the previous swing high, which is $51.69 in this case. So I'm putting my stop just below the low of the fry pan bottom ($49.50) , at $49.25.

OK, we're in a little early, so if we get a gap up we're good. Let's see what happens.

Oh, by the way, I used a simple Call for the third target because the 55 and 54 strike Call options were worth very little, so it wouldn't reduce my cost (risk) much to short those.


Thursday, January 19, 2017

SPY Flag Breakout Exit


Bad news is I closed out of this trade with a loss. I had bought the SPY Mar 232 Calls for $2.00 and sold them today for $1.18. I sold because just before the close at 4pm ET, there was a bearish engulfing candle and a close below the 8ema. You can see this on the chart above. This is a bearish candle signal and the prudent thing to do is to exit and take the loss, rather than hope and pray it turns around tomorrow. Chances are it will continue down, and maybe even gap down at the open tomorrow, and the loss could be much higher. You must be willing to take controlled losses when trades don't work out, because they don't work out all too often.

Good news is that I followed my discipline. Which, after 6 years of trading, still is not easy.

This chart is a good example of the Halfway level of a measured move providing resistance. See the short white horizontal line, like a hash mark, across the middle of the vertical thick white line? That's halfway up the measured move to the anticipated target. See how that Halfway level held the candles from closing above it? I see this quite often.

Well, tomorrow is the Trump inauguration as well as option expiration day. You'd think the VIX would be higher, but it closed the day at only 12.78. It will be interesting to see what happens.

Wednesday, January 18, 2017

XLP Scoop Pattern Update 1


As of lunchtime, our position is working nicely.

I added a horizontal line labeled H. It marks the Halfway point of the measured move (it bisects wave AB). I have found that there's often resistance at the halfway point. Sometimes it's so strong that price reverses there and doesn't retest for a very long time. So, a conservative strategy is to set the halfway mark as the target. Or, you can sell some of your position there and move your stop to break even.

Also, if you look back to late Oct. - early Nov. you'll see there was congestion right at the halfway mark level. That can provide resistance also.

Then we have the 200SMA a little higher, and we have the inauguration on Fri. So this may be a bumpy ride.

The Scoop pattern often leads to a strong move. Since the option spread provides a fixed risk, I will probably hold through all the bounces, unless we hit my stop.

Tuesday, January 17, 2017

XLP Scoop Pattern


Today as of 11:00am ET we have a large green candle. If we close over the 8ema (orange) then we will have formed a "Scoop" candlestick pattern. This is a very bullish pattern. It starts about 12/15/16. See how from that date to 1/6/17 it is a sideways handle followed by a dip or a little cup? That looks like a ladle or a scoop. Also, yesterday was a doji and we gapped up today. A gap up after a doji is also a bullish signal.

The DI+ crossed up over the DI- indicator. This is a supportive signal.

To be conservative, I should wait until the close today and make sure we don't retrace all the back to the 8ema or lower. But the scoop pattern can result in an explosive move, so I'm going to be a little aggressive and get in now (mid-day).

So, I got some March 52/54 Call Spreads for .84. I chose March to reduce Theta time decay and give myself some time if I need it. An option spread, versus a simple option, helps with the Theta decay since you're selling an option as well as buying one, but it doesn't eliminate it. I chose the 54 strike because 54 is my short term target. The maximum risk is the cost (premium) of the spread. The maximum reward is the width of the spread, which is 54-52=$2. So the reward to risk is better than 2:1.

I chose a target of 54 because of 2 reasons:


  1. The measured move is the length of the previous wave up. The previous wave up is from point A to point B. The thick white vertical line is the same length, drawn from the bottom of the scoop.
  2. There is resistance from August right at 54. See the thick white horizontal line.

I'm using a stop of 51.25 on the XLP stock. If price gets down there then its below the scoop and that's a bearish sign. I'm using a Limit Sell order for the option spread of .15. If its worth less than that, I'd rather hold it for a possible reversal.

Of course anything can happen, and we have the Trump inaugural on 1/20/17 which could ruin the pattern, but my biggest technical worry is the 200SMA (Simple Moving Average; white meandering sideways line). That will probably provide some resistance. I'm planning on a small pull back when price hits it at about 53, then we reverse back up and go through the 200SMA and on up to the target at 54.

Tuesday, January 10, 2017

VIX possible bounce Update 5

Just a quick update. Normally I would have closed out this trade several days ago. But when the indications were to exit the trade, the options were worth so little, they seemed more valuable as lottery tickets than the little cash their sale would garner. So I kept them in case we got the spike in volatility I was expecting.

The options will expire Jan 20th. The most likely outcome now is for them to expire worthless. The good news is that we got a spread which reduced our cost and limited our risk. Not all trades work out even if you do everything right. However, when they don't work out, I always feel like I did something wrong. So I look over the trade and my decision process, and try to find any mistakes or lessons I can learn.

On this trade, it would have been more prudent to have waited for a close above the 200 sma before entering. The candlestick signal was so strong I thought it would, but it didn't. So I took a more aggressive trade and will probably pay the consequences. If I don't like it, then don't take aggressive trades.

Friday, January 6, 2017

SPY Flag Breakout


This looks like a Flag Breakout on the SPY daily chart. The down channel I outlined is the "flag". Notice the last doji candle at the end of the down channel. There is a red candle to the left and a green candle to the right. This is known as a Flutter Kicker signal. A very bullish candlestick signal. The green candle closed outside the channel. The next day (1/5/17) was a doji. Then today we had a small gap up, and after some settling out at the open, we continued higher. If the day closes with this configuration then its a doji sandwich, which is also a bullish signal.

Some counter indicators I see are the high stochastics, decreasing daily volume, possible resistance at the previous swing high, and the fact that, as I write this (1:00pm ET), price is at the halfway point of the length of the previous wave up.

Let me explain this "the halfway point of the length of the previous wave up". See the mostly vertical, thick white line segment extending up from the most recent swing low? That's the length of the previous up wave from 12/2/16 - 12/13/16. Then, see the little, thin white, horizontal line segment cutting across the middle of the thick white line segment? That's the halfway mark. I've noticed that very often a new wave will only go half the distance of the previous wave. So I mark it off as possible resistance.

So, I wouldn't be surprised if we get a pull back, but this looks like a strong enough setup that its worth the risk.

For a target, I'm using the 127.2% Fib extension of the last wave up. You can see on the chart it occurs at about $230.86. So, to be a little conservative, I set a target of $230.50.

To control my risk I'll use a Call option. So I got some Mar 17th 232 Call options. I picked that strike price because the current Delta is about 32. I picked the Mar contract to get a lower Theta than a closer month. If I was more confident about this trade I would use a higher strike and a closer month. But because of the counter indicators I mentioned above, I want to decrease my risk.

After the last post, which was on a SPY dip, I'd sure like to show you a winner this time. But win or lose, from what I've been taught, the odds are in my favor and I have definite thought out, risk controlled plan, so let's take the trade and see what happens.

Wednesday, January 4, 2017

SPY Dip Update 3


I'm out. Had to bite the bullet and take the loss. There are 5 bullish signs on the chart at the close:

1) Notice today's candle is closing above the recent channel.

2) Notice today's gap up at the open, which was not filled, after yesterday's doji. Indecision has turned into decisiveness.

3) The combination of today's candle and the previous 2 days forms a Flutter Kicker signal, which is a strong change in sentiment.

4) The DI+ line crossed up over the DI- line.

5) The 14 day Stochastics crossed upward.

Plus stochastics has plenty of room to run.

So, one must accept the facts and switch mental gears. The recent down channel, with proper confirmation, was really just a Bull Flag. Did I do anything wrong? No, not wrong. You could say down channels usually break to the upside, so I could have been more cautious and waited for a break out of the channel to the downside. Technically I think I did everything right, but I could have had more respect for the possibility this was a bull flag in the making.

The bottom line is that not all trades will work, whether taken for a fundamental reason or a technical reason. A good trade is not necessarily the trade that worked, its the trade that followed all your trading rules. I followed my rules and I was patient for a definitive outcome, and I exited rather than hold on for hope's sake alone. So I will classify this as a good trade. It just doesn't feel that way when I look at the little divot in my P&L.

Tuesday, January 3, 2017

VIX possible bounce Update 4


Just before the close today, the chart looks very bearish. The last 2 candles on the daily chart have formed the Kicker signal. This is normally a very bearish signal. If this was any normal security I would sell my position. But the VXX has a natural price decay built into it and it is supposed to represent the VIX. I believe tomorrow is the last official day of the Santa Claus Rally (the 2nd trading day in Jan). I'm expecting volatility to pick up shortly and my risk is limited to the cost of my option spreads.

So, I'm going to ride this a little longer. I should tell you though, trading a VIX based instrument has almost always not turned out well for me. I should really leave this vehicle to my sim account for a while.

SPY Dip Update 2


At 10 minutes to the close, we have a doji on the day right on the 8 ema. The faster Stochastics are turning up, but I'm going to hold the position another day.

SPY Dip Update 1


1/3/17 Regular cash market opened today with a gap up on SPY, then went higher. This caused a candlestick "Kicker" signal to form on the daily chart, which is very bullish. But it only matters if that is still in place when the cash market closes at 4:00pm ET. The Kicker signal lasted up to about 10:30am which had me very concerned. But then SPY turned down and by 11:00am the Kicker completely disappeared.

Strategy now is to stay in the trade unless we break the current daily down trend channel to the upside with confirmation the next day.

It's still a long way to the close, but whatever the chart looks like at the end of the day, I'm proud of myself for having the discipline to wait. Discipline is what was most lacking in my trading last year. That must change this year.