Monday, February 28, 2022

Hogs Turned Tail - Update 2


Today's price action made a Doji candle on the Daily chart above, which makes me nervous. A Doji candle represents indecision. If we form a green candle tomorrow, across from red candle from the previous day (Fri), then that would create a Morning Star candlestick pattern, which is Bullish. Not good for our Bearish trade.

We also appear to be experiencing support from the 20sma, which could lead to the green candle tomorrow that we don't want to see. In addition, volume has been steadily decreasing, which is not encouraging.

However, on the other hand, we did form a lower high and a lower low today, and Stochastics are not yet oversold. These are constructive to our Bearish position.

It was a harder decision today, whether to exit or not, than it was the previous trading day, which was a Friday, which is a little ironic. Meaning I'd rather leave the position at risk for 3 days, than just 1 day.

While there's a real chance we've just formed a swing bottom, I think it would be more an act of fear than playing the odds to exit today. We're still looking at a strong case for a continued down trend. It would be a mistake to get out today just because we hit some support and made a Doji. There's no real indication we'll reverse tomorrow even though we certainly could.

So, bottom line, at the end of the livestock market Close at 14:05 ET, I exercised my courage and decided to hold the position.


Friday, February 25, 2022

Hogs Turned Tail - Update 1


Now is when we should have entered this short trade. Now that we have confirmation from a continuation candle to the downside. This, of course, adds to our conviction we're in a trade with good chances for success.

We formed a lower high and a lower low, while Stochastics are still in the mid-range. These are constructive for our trade.

However, the candles are getting smaller and the volume is also getting smaller. These are not constructive. Although, today's volume bar is larger than the largest recent bullish volume bar 3 days ago. That mitigates the previous point somewhat.

We also got an assist from the Live Cattle, Corn, Soybean, and Wheat markets. They all took a nice nose dive today.

Being a Friday makes the hold, add, or exit decision a bit harder because we have more risk waiting 3 days than the usual 1 day. But the decision to hold our position at the 14:05 ET lean hog market Close was an easy one.


Thursday, February 24, 2022

Hogs Turned Tail


Looking at the April Lean Hogs futures daily chart above, I see some Bearish indications. We should wait until we get continuation to the down side tomorrow, but I will be too busy at the Open tomorrow to be as effective as I can be today when I have time to make a considered move. So, I decided to get in short early even though I recognize this could hurt if it goes the other way.

Here are the Bearish indications I see:

  • 3 Drives to a top.
  • Bearish Engulfing candlestick pattern.
  • Close below the 8ema. 1st candle to do so since the drive began.
  • Close near candle bottom on today's and yesterday's candles.
  • High Overbought Stochastics.
  • High Volume, indicating enthusiasm.
For the Target, you could make an argument the 38.2% Fibonacci retracement would be a good place. It coincides with a Support and Resistance level. We may in fact exit at this level but judging from the Stochastics and the enthusiasm, it looks more likely we'll make it down to the 50% Fib, which also coincides with a Support and Resistance level. I drew 2 thin, white, horizontal lines to mark this S/R level. The 50% Fib is at 98.225.

So, we'll target the 50% Fib but retain the option to get out at the 38.2% Fib if conditions suggest that is a better idea when price reaches it.

Speaking of options, we entered our short position by buying an April 104 Put for 4.4250 points. The Lean Hogs market has no mini contracts and its a relatively thinly traded market that's only opened 9:30am ET to 14:05 ET. With a point value of $400/pt, we need to control our risk somehow, and Options are the only way.

The April 104 Put option cost 4.425 * $400/pt = $1,770. The underlying HE price was 105.550 at the time we bought the option. It had a Delta of 43%.

The best Stop would be just over the recent swing high at 112.850, but that's a little too much money to lose if we hit it. For example, let's say we use a Stop of 113. The loss would be approximately:

113 - 105.55 = 7.45 Points * 43% Delta = 3.2035 * $400/pt = $1,281.40.

So, instead, we're using a Stop that's just over the high of today's candle at 110. It could certainly be hit by a reasonable retrace tomorrow. A 50% retracement of today's Close (105.4) to the swing high at 112.85, would be (112.85+105.4)/2=109.125. A 61.8% retracement would be 105.4+.618(112.85-105.4)=110.0041. We used 110.500 as a Stop, which is over the 50% and 61.8% retracements, but not by much.

Our dollar risk amount is approximately:

110.50 - 105.55 = 4.95 Points * 43% Delta = 2.1285 * $400/pt = $851.40.

I say approximately because the Delta will change as price moves. If price moves against us, then the Delta should decrease a little. Which would be more than welcome. You can use the option Gamma to estimate the Delta when the underlying hits 110.50, but its not worth it in this case.

Summary:

Bought HE Apr 104 Put for 4.4250 points, when HE was 105.550.
Stop when HE is 110.50.
Target when HE is 98.325, which shades our expected target of 98.225 by .100 points for slippage.
.100 points is .1/.025 = 4 ticks in the future and .1/.0125 = 8 ticks in the option.

Risk: $851.40 from calculation above
Reward: 105.55 - 98.325 = 7.225 Points * 43% Delta = 3.10675 * $400/pt = $1,242.70
R:R = 1242.70/851.40 = 1:1.5 not a great ratio but given the uber Bearish investor environment, thanks to Russia's invasion into the Ukraine, plus the Bearish indications discussed above, I think its adequate to take the trade.


Friday, February 11, 2022

Golden Gartley - Exit

GC Apr 4hr


Well, that went well...not! News came out that Putin decided to invade the Ukraine and Gold went nuts. Straight up like a bottle rocket. Fortunately, I had a Stop working at 1845. At 16:45 ET, the high today was 1867.40. If I ratcheted my Stop up, or worse, deleted it, my situation would have been much worse.

My gut reaction is always "What did I do wrong?" and whether I did something wrong or not the next question is "What can I learn from this?", then finally "How can I improve my trading going forward?". 

The answer to the first question is I didn't do anything wrong. I entered a valid pattern that has about a 75% Win Rate, which means it fails 25% of the time. This is one of those trades in the 25%. Its that simple. I followed my rules, so I didn't do anything wrong.

What I can learn is always use a Stop. And unless there's some unusual circumstance, don't move it because you think it might get hit. Duh! 

Also, its a good opportunity to learn how to accept a loss. It feels bad, but you know before you go into the trade there's a significant chance it will fail. So why feel bad when it happens? Because its human. But it helps to remember there will be many trades in the future where this pattern will win. Its been in the public about 36 years thanks to Mr.  H.M. Gartley. So we know it's reliable. No need to start blaming this and that. It doesn't matter. This pattern will occasionally fail no matter what.

Once you have a methodology with an edge, all that matters is your faithful execution.

Bottom line:

1814.90 Entry - 1845.10 Stop  = -30.2 pts * $10/pt = -$302.00 loss.

Thursday, February 10, 2022

Golden Gartley

GC Apr 2022 4hr


Annotations for this trade are in yellow on the 4 hour April 2022 Gold Futures chart above. You can see the X,A.B, and C points of the Gartley (aka XABCD) PATTERN. The first D point I chose was surpassed by higher price action. So I changed the label from 'D' to 'D1", then added the D2 point when I thought it appeared. But this was also surpassed by the D3 point, which was today.

As you might guess, I've been in this trade for a while, but I haven't posted about it. I don't include most of my trades in the blog because either they are on a short time-frame, or high risk, or I just don't have the time. I'm including this trade now because I think D3 is the final D point for this Gartley pattern.

We had an impactful CPI report this morning, 2/10/2022 at 8:30am ET, which led to a rather dynamic day in the price action. Looking back on this 4 hour chart, you can see we formed a Bearish Engulfing candlestick pattern, with a close below the 8ema, followed by a continuation candle. This is significantly more bearish than the other D points. Plus Stochastics really took a dive.

What you can't see is how close today's high came to the Stop. Here's how I entered this trade on 2/7/22:

Entry: 1814.90
Stop: 1845.00
D3 Target: 1804.60 (the D1 and D2 targets were lower and no longer of interest)

Today's high was D3 at 1843.30, just 1.70 points from the Stop. That was just luck, and I'm very grateful to be so lucky.

The current targets are shown on the chart in yellow. The actual target for this trade is 1806.00 which shades the exact target to accommodate the Bid/Ask spread, and other slippage.

OK, now we're all caught up. Let's see what happens next in this crazy market.


Tuesday, February 8, 2022

March Bear Corn - Exit

March Corn Daily 2/8/22


Sunday evening 2/6/22 10:55pm ET I Tweeted:

March Corn Daily 2/6/22


"Its Sunday night and we gapped up at the Open, then started drifting down. I believe the most likely action from here is for March Corn Futures to fill the gap and reverse back up. Therefore, I entered a limit buy order at break even, which is 622. The previous Close was 620 1/2, so we should hit 622 on the way. In case price doesn't come down to 622, I also entered a Stop at 630 just over the current high."

As you can see on the top chart, from today, price did continue downward as I said, but it didn't come down as far as I thought it would. So it hit the 630 Stop.

A "Doji Gap Up" 2-candle pattern is very Bullish. So, rather than hold on and see if it just does a small retrace upward and come back down, it seemed much wiser to exit and wait to see what happens.

This strong change in sentiment was quite a surprise when I saw it, but not surprising in the bigger picture. It's happened to me before and will most likely happen again. It's just a part of trading. Anything can happen and we have to be prepared to deal with it when it does.

Summary:

Entry: 622 1/4
Exit: 630 1/8

Loss: 622 1/4 - 630 1/8 = -7.875 * $10/pt = -$78.75


Friday, February 4, 2022

March Bear Corn - Update 2


On today's Daily chart above, you can see we formed a Bullish Harami candlestick pattern. This is concerning for our short trade, but we closed below the 8ema and Stochastics are still in the mid-range. 

We made a lower high, but also made a higher low. It's possible we just go sideways until the WASDE report next Wednesday. It's also possible we're in the process of bouncing off support from the swing high on 12/28/2021.

So, while not a confident decision, I decided to hold the position based on all the bearish indications that got us into this trade plus the fact we closed below the 8ema.


Thursday, February 3, 2022

March Bear Corn - Update 1

Zoomed in Daily Chart


We had a nice continuation day today. Got a lower high and a lower low. Still plenty of runway on the Stochastics before its oversold. Definitely still Bearish.

For comparison, I added the 2 major previous down legs. See the yellow and green diagonal line segments. See yesterday's wider view to see where these previous moves came from. We already dropped as far as the green line. We did that today. The yellow line takes us down a little further and pretty close to our target. If you think of these moves as the BC leg of an AB/CD pattern, you often will see these can be similar in length for a given trend. You might call it symmetry. You can use symmetry as a rough measure of a similar future move.

Tomorrow is Non-Farm Payroll day in the USA at 8:30am ET. I doubt it'll have much influence on the Corn market, but I haven't done any research to back that up. If it does move, I'm going to do my best to let the Stop handle it. I don't want to get shaken out in the morning and then see a big reversal back down by the end of the day.

It was an easy decision to hold the position at the end of today. Tomorrow will be harder because its a Friday and weekend risk always weighs on me, especially with what's happening with Russia. But I'll leave that for tomorrow. As for today, we're looking good.


Wednesday, February 2, 2022

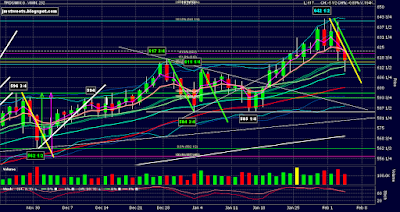
March Bear Corn


Wide Daily View

Narrow Daily View


Entered a short on March Corn Futures from 622 1/4, using a YC mini contract at $10/point, right at the market Close today. ZC is the full sized contract at $50/pt.

The Daily charts above are very busy. Please focus on the light blue annotations. Here are the bearish indications I see:

  • 3 Drive to a Top
  • Completed AB=CD (see the 2 longest, thick, white, angled, line segments)
  • Bounce off Previous High (see the wide view chart)
  • Bearish Harami candlestick pattern
  • Bearish Engulfing candlestick pattern
  • Close below 8ema
  • Large candle with Large volume
  • Negative Stochastics Divergence
  • High Stochastics
  • Bounce off Lt Blue 161.8% Fibonacci extension

Selecting the Target at the top of previous congestion, which is coincident with the 50 sma (thick red wavy line). This at about 600.

I set the Stop at 643, just above the recent swing high of 642 1/2.

I think its likely we'll get a bigger pullback but I want to be out of this trade before the big USDA reports on 2/9/22 at 12:00pm ET. Sometimes you see this list abbreviated, or nicknamed, the WASDE Report. Here's the list of reports due out at 12:00


So, in addition to a Stop and a Target, I also entered a conditional order to close out this trade at 11:45am ET on Wednesday 2/9/2022.

Summary:

Entry 622 1/4
Stop 643
Target 602

Risk = 622.25 - 643 = -20.75
Reward = 622.25 - 602 = 20.25
R:R = 1:1 which is worse than the recommended minimum 1:2 ratio but this looks like a high probability trade.