Monday, November 30, 2020

Corn Looks Wilted


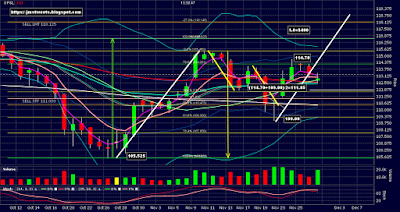
Shorted March Corn near the close from 426 1/2 on the Daily chart. Here's what I saw:
  • Bearish engulfing candle
  • Close below 8ema
  • 3 drives to a top
  • Stochastics Overbought
  • Negative Stochastics Divergence (NSD)
  • High volume
  • Corn, Soybeans, Soy Oil, Soy Meal, and Wheat all have short signals today.
  • Full Moon
Considering today starts a Full Moon may seem like a joke to the uneducated trader. You'd be surprised how much work has been done on this subject. Its been shown there is a strong, but not perfect, correlation between full/new moons and the grain markets. There are correlations with other markets too. It works best at market extremes, not as well if the market is moving sideways.

I try to keep an open mind. If something works in the markets I want to use it. I don't care how crazy it seems. I'm not trading to be popular, I'm trading to make money. Ignore proven natural cycles at your peril.

The NSD can be seen if you notice the short white angled line segments spanning the last 5 trading days. One is over the candle tops and one is in the Stochastics panel on the bottom of the chart.

Since we haven't seen confirmation of a down move yet, I'm using the YC mini contract, which is $10/pt rather than $50/pt for the full ZC contract. If things develop properly I'll scale in with more contracts. 

Target 50% Fib 385 1/2
Stop 440

Risk: 426 1/2 - 440 = -13 1/2 * $10/pt = -$135.
Reward: 426 1/2 - 385 1/2 = 41 * $10/pt = $410.
R:R = 3:1 which is ideal.

The 440 Stop is just over today's high, which is also the high since the upswing started at 331 1/2 mid-August. If price gets up there something is wrong with this trade.

You might notice comments on the chart about retracements being less than 38.2%. I was looking for another Fib range to find some confluences but Larry Pesavento teaches that if a pullback doesn't reach 38.2% then don't consider it as a Fib range. So, using that rule, this has been one big upswing from a Fib perspective. That being the case, if we started a downtrend today, then we can expect a retracement of at least 38.2%, 50%, or 61.8%. I have found that 50% is most common in general trading.

Live Cattle Looks Bullish - Exit


Today ended with a doji but the open and the close were both under the 8ema. That's a little bearish. The doji candle represents indecision. The next decisive candle will resolve whether we continue down or up.

The previous 3 candles form an Evening Star pattern. That's bearish.

Looks like we made a new lower swing high. That's bearish.

We never cleared the previous swing high at 115.45. So really, we should have waited to close above that before entering. I was somewhat aggressive here and broke that rule. So I can't really complain if we make new lows before making new highs, if ever.

So, given that we got in too early and these other bearish indications, the best decision seemed like exiting here to limit our losses. We can get back in after we see how the doji is resolved.

Summary:

Entry 113.025
Exit 112.80
Loss .225 * $400/pt = -$90

A very reasonable loss considering this futures contract covers a lot of ground. For example, just 3 trading days ago we hit a high of 114.70. 114.70 - 113.025 = 1.675 * $400/pt = $670.

Here's another thing. If our hedge order was filled (see "Live Cattle Looks Bullish - Update 1") we'd be ahead. Our limit order was for $500 premium. Today's last trade for the 118 Call option was .825 * $400/pt = $330. If we covered our short position there, we would have made $500 - 330 = $170 on the hedge. Then we would have netted 170 - 90 = $80 instead of losing $90.

Paraphrasing Adele, sometimes it lasts in trading, but sometimes it hurts instead.

Friday, November 27, 2020

Live Cattle Looks Bullish - Update 3


From yesterday's post "One might worry this is the left half of an Evening Star presaging a down turn reversal.". Well guess what? It was. This could be a very bad indication for this trade. I was very tempted to close out the trade at break even. 

Why didn't I? I'm afraid I'll be asking that question when I'm down big time. But I stayed in the trade because:

  • We didn't close below the 8ema.
  • Stochastics aren't overbought.
  • The initial conditions for this trade were strongly bullish.
  • I've seen many times where an Evening Star would close very near the 8ema then reverse back up.
  • Today is the Friday after Thanksgiving and the "real" participants were probably not trading.
I re-entered the hedge trade, but since we went almost straight down, the Limit order never filled. 

So we closed the day, with no hedge, almost precisely where we entered the original trade and watched what was once a 114.70 - 113.025 = 1.675 * $400/pt = $670 gain at the high 2 days ago disappear. Not fun.

Now we have to wait out the weekend and see if we get a reversal or a continuation. LE doesn't have overnight hours, so we have to wait for the 9:30am ET open. I look forward to a fantasy future when we have 24/7 markets for everything.


Wednesday, November 25, 2020

Live Cattle Looks Bullish - Update 2


Today opened with a gap up, which is bullish, then filled the gap in, touched the 3ema, and closed very near the open, thereby forming a Doji. The Doji is a neutral indication but closing near the top of today's range and above all the MA's is a bullish indication.

One might worry this is the left half of an Evening Star presaging a down turn reversal. This could happen, especially after a long 4 day weekend with 3 days closed and 1 partial day. But, notice Stochastics are still not overbought. We definitely want to stay in the trade.

We put in a Day order again today for the hedge I explained in the last post. However, price didn't rise enough to trigger the order. So we enter the 4 day holiday period without a hedge. Not as comfortable as I would have been if we had sold the Call option.

However, let me share the following scalp trade I made today:


This is a 10 minute chart of Jan Natural Gas today. Compare this chart with the Feb Live Cattle Daily chart above. Notice something interesting? It's the same pattern. I didn't check all the compliance rules but the NG 10 minute pattern looks a lot like a Gartley Pattern, and the LE Daily is a confirmed Gartley Pattern.

There's a relatively long uptrend followed by a 61.8% Fib retrace in the form of an AB/CD pattern. Then a resumption of the uptrend. You can see this same exact behavior on both charts.

This is a good illustration of the fractal nature of the markets. But that's not why I posted it. The NG chart hit not only the 27.2 Fib extension but also the 61.8% Fib extension as well. In our LE Daily chart we're setting the target for just the 27.2% Fib extension. The ideal execution of the NG 10 minute scalp trade gives me encouragement that our LE swing trade will also hit its target.

Tuesday, November 24, 2020

Live Cattle Looks Bullish - Update 1


Look at this beautiful confirmation. Made a 114.70-112.75 = 1.95 * $400/pt = $780 move today and a 113.95 - 112.75 = 1.2 * $400/pt = $480 gain on the close for the day.

Yesterday's upper wick, which seems like profit taking, was 113.625 - 112.90 = .725 points.
Today's upper wick was 114.70 - 113.95 = .750 points. Very symmetrical. Not sure its all that suggestive of what will happen next, but the more orderly the price action is the better, in my opinion.

Notice today's open is also the low of the day. That's a bullish sign.

Also notice Stochastics are still in the mid-range, giving us plenty of room to run.

Volume is a little lower, which is reasonable considering we're heading for the Thanksgiving holiday in the USA. But volume is still respectable, based on the chart.

You'd have to say we're nicely on track. However, we could just be retracing the previous AB/CD down leg before reversing and heading back down. We won't know if we're in that temporary retracement or going up to our target until we close above the previous swing high at 115.45.

The unusual length of the time the Live Cattle market will be closed for the holiday has been weighing on me. So I did some analysis on how we might hedge our position and came up with something interesting using options.

I figured out a way to hedge the long Live Cattle position that will limit our loss to $300 instead of $800, assuming our stop is hit, and it only costs $60 of potential profits out of $2000. 

Yesterday (rounding to whole numbers):
Entered at 113
Target 118
Stop 111

Risk=111-113=-2*$400=-$800
Reward=118-113=5*$400/pt=$2000

Today when Feb LE was 114.50, the 118 Call option was selling for $500 with a Delta of 30%.

Our paper gain was 114.50-113=1.5*$400/pt=$600 profit

If LE goes to target, we'd make another 118-114.5=3.5*$400=$1400 profit

If we sell a 118 Call, and use an average Delta of 40%, then we'd lose 114.5-118=-3.5*40% Delta=1.4*$400=-560 loss. And we'd make $500 in premium from selling the option.

Delta's are always about 50% when the underlying is at the Strike Price. Our Strike is 118 which is also our target. So the current Delta is 30% and the Delta at our target is 50%. That's why I used an average Delta of 40%.

So the new trade would be,

Risk: 800-500=$300 loss if stop is hit, instead of $800 with no hedge.
Reward: 600+1400+500-560=$1940 net profit, instead of $2000 if target is hit with no hedge.

So saving $500 in potential losses for a cost of $60 of potential profits.

This seemed like a good idea, so I entered the order to sell a 118 Call for $500. At which point LE immediately started dropping, so the order wasn't filled. So, we'll take another look at the situation tomorrow and decide what to do.

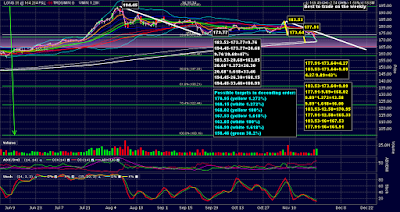
Possible GLD Targets to the Downside


By calculating some typical Fibs on three different ranges, as shown on the charts above, here are some likely targets for GLD to bottom out and reverse. These do not include the 200sma (white curved line) which is also a good candidate, but it changes value everyday.

The top chart is zoomed out so you can see the green range. The bottom chart is zoomed in so you can see the other ranges.

There are other targets below this set, but this seems like a probable range. Of course, anything can happen.

Possible targets in descending order:

170.95 (yellow 1.272%)
168.15 (white 1.272%)
168.02 (yellow 100%)
167.53 (yellow 1.618%)
162.85 (white 100%)
160.99 (white 1.618%)
158.46 (green 38.2%)


Monday, November 23, 2020

Live Cattle Looks Bullish


Went long Feb Live Cattle Futures (LE) from 113.025. It's $400/pt.

Here's what I saw:

  • Bounce off the 61.8% Fib retracement of the yellow range.
  • Bounce off 200sma.
  • Bounced off 1st AB/CD (thick yellow slanted line segments) in an uptrend.
    • Possible Gartley pattern.
  • Morning Star like candlestick pattern.
  • Doji gap up.
  • Closed above 8ema and 50sma.
  • Above all MA's.
  • High volume.
  • Stochastics are mid-range; plenty of room to run.

Target white (thick slanted line segments) AB/CD = yellow 27.2% Fib Extension = 118.145.
Stop just under bottom of the candle at 111.00.

Risk: 113.025-111.00=2.025*$400/pt=$810
Reward: 118.145-113.025=5.12*$400/pt=$2,048
R:R=2.025/5.12=1:2.53

Anything can happen but this looks like a good setup. What worries me the most about this trade is that we'll most likely have to wait out Thanksgiving, the low volume Friday after, and the weekend after that.

We would need some big candles to avoid holding over the 4 day weekend coming up. Today's close is 112.90. Se we need to go 118.145-112.9=5.245 points to hit the target. Look at the size of the green up candle on 10/29/20. The open was 107.650 and the high was 110.650, so the difference is 3.0 points. We have 2 trading days before Thanksgiving. If we got 2 of those candles, 3+3=6 and 6>5.245. So, 2 of those candles would hit our target, without the need for any gap ups. But this is definitely hopeful thinking and not very likely. But not impossible. We shall see.

Friday, November 6, 2020

How I Used Hedging with EUR Mini's


The full size EUR/USD futures contract is $12.50/pip. The minimum tick (price increment) is half of a pip (0.00005). The symbol on Interactive Brokers is EUR.

The mini size is $1.25/pip. The minimum tick (price increment) is one pip (0.0001).  So the mini is 1/10th the size of the full contract, which of course means you need 10 mini's to represent the same position change as the full contract. The symbol on Interactive Brokers is M6E.

The mini has much less volume than the full contract. For example, as I write this at 12:22am ET, the full size EUR Dec Futures has 627K volume, whereas the mini has volume of 12.8K. The other disadvantage is the minimum tick (price increment). The full contract has a resolution down to a half a pip, while the mini has a minimum tick of a full pip. These 2 disadvantages are true for many, if not most or all, of the full/mini futures pairs.

However, there are 2 wonderful advantages of having the mini contracts. Scaling and Hedging. 

Scaling is starting a position with a small entry and adding more contracts as price action moves in your favor. You can do the same on the way out of the trade by taking contracts off as you hit sequential targets. Scaling keeps your loss lower if the trade goes against you and hits your Stop. It also enables you to let your trade run by taking off just a partial position rather than your whole position when you hit the closest target.

Hedging is taking a different position in the opposite direction for protection rather than exiting your trade, as you would with a Stop. This is what I did today. It worked well and I'll discuss it next.

The setup is based on the yellow range on the chart above. Price had just hit the 61.8% of the green range (partially shown) and took a little dip down to the 38.2% Fib of the yellow range, then bounced off and rose to breakout to the upside at point labeled "A". This setup has the yellow 61.8% Fib Extension as the target and the bottom of the yellow range as a Stop.

When you dip down to a retracement not as far as the 50% level and bounce back up and break out, that usually means one of two things. Either you have very strong momentum, so much so you couldn't dip down to the 50%, which is much more common than just the 38.2%, in my experience, or you have a false break out and you're going back down to the 50% or maybe the 61.8% or even lower.

I wasn't sure which one of these 2 likely situations I was in. If we dipped back in to go hit the 50% level then I felt pretty confident we'd reverse and eventually hit the yellow 61.8% Extension target. Notice the 61.8% yellow extension is in confluence with the 161.8% Fib Extension of the green range. That makes this a likely target.

So I wanted to give the trade a chance to work, and therefore not exit until the proper Stop was hit. But I entered long with the full contract at 1.18975. The Stop was just under the yellow range at 1.18340. That's a potential loss of 1.18975 - 1.18340 = 63.5 pips x $12.50/pip = $793.75. That was doable but the profit potential was 1.19270 (Target) - 1.18975 = 29.5 pips x $12.50/pip = $368.75. That's a terrible Risk:Reward and I really didn't want to put on that trade on a Friday during this very volatile time of being in the middle of determining who won the Presidential election, Covid cases getting worse, and more. I reference the headline risk because the wrong headline from the USA or Europe could drive the price straight down and fast.

My solution was to use hedging. After the breakout and the Buy Stop order was triggered to buy 1 full contract, I entered the following order using the mini contract:

Sell Stop 10 M6E at 1.18870, with a Buy Limit order at 1.18340. Remember 1.18340 was my Sell Stop for the Full contract. I also staged an order, a Buy Stop for 10 M6E at 1.18870. This staged order was to exit the hedge on the way back up.

This hedge would lock in a maximum loss of 1.18975 - 1.18870 = 10.5 pips x $12.50/pip = $131.25. This works because as the Full contract is losing value when price is falling, the mini position is gaining value. Even if price fell all the way down to the Full contract Stop, and we exited both the Full and mini positions, the loss would still be only $131.25. Remember, without the hedge the loss would be $793.75.

So, as you can see on the chart, price did an abrupt turn around and fell hard. The hedge was triggered at "B" on the chart and I went Short 10 mini contracts at 1.18870. Once I was significantly below the staged hedge exit order, I submitted it. Then price hit the yellow 50% Fib retracement and went down a little further, almost hitting the yellow 61.8% Fib. After that price started running back up.

The original plan was to let the hedge exit order take off the hedge for a break even. But at point "C" on the chart I was confident enough to take off the hedge at 1.18770, yielding a profit of 1.18860 - 1.18770 = 9 x $12.50 = $112.50 from the hedge.

As you can see, price continued up and into a positive position. Since we already hit the 50% Retrace and came all the way back up, there is no good reason, in a healthy trade, to take a leg back down. So no need for a hedge. Instead I can just use a tight stop. Which was hit at the point labeled "D".

I ended up with a small profit. Now I see volume is fading and time until the end of the trading week is not far off on a 15 minute chart. I expect volume to continually fade and candles to continually shrink. So I will watch the chart but probably won't re-enter this trade.

The bottom line is that hedging was a great solution and worked as expected. Even better actually. And it wouldn't have been possible without the mini sized futures contract.