Wednesday, July 27, 2022

Energy May Be Turning On - Exit

XLE 3 minute


We had a little gap up at the Open followed by a retracement to fill the gap. This is the same behavior as yesterday, when I described it as a possible "Exhaustion Gap". 

Given 2 days of this price action, and the Federal Reserve FOMC rate decision announcement later today at 14:00 ET, it seemed like a good idea to exit with what profits we had left, and wait out the announcement.

Sold the XLE Sep 75 Call for 3.54 at 10:30am ET. Profit is (3.54 - 3.05) * 100 = +$49. per option.

49/305 = 16% gain. Not bad for 9 calendar days. If you annualized it, it would be 16 * 365/9 = 649% annual return.


Tuesday, July 26, 2022

Energy May Be Turning On - Update 4

XLE Daily


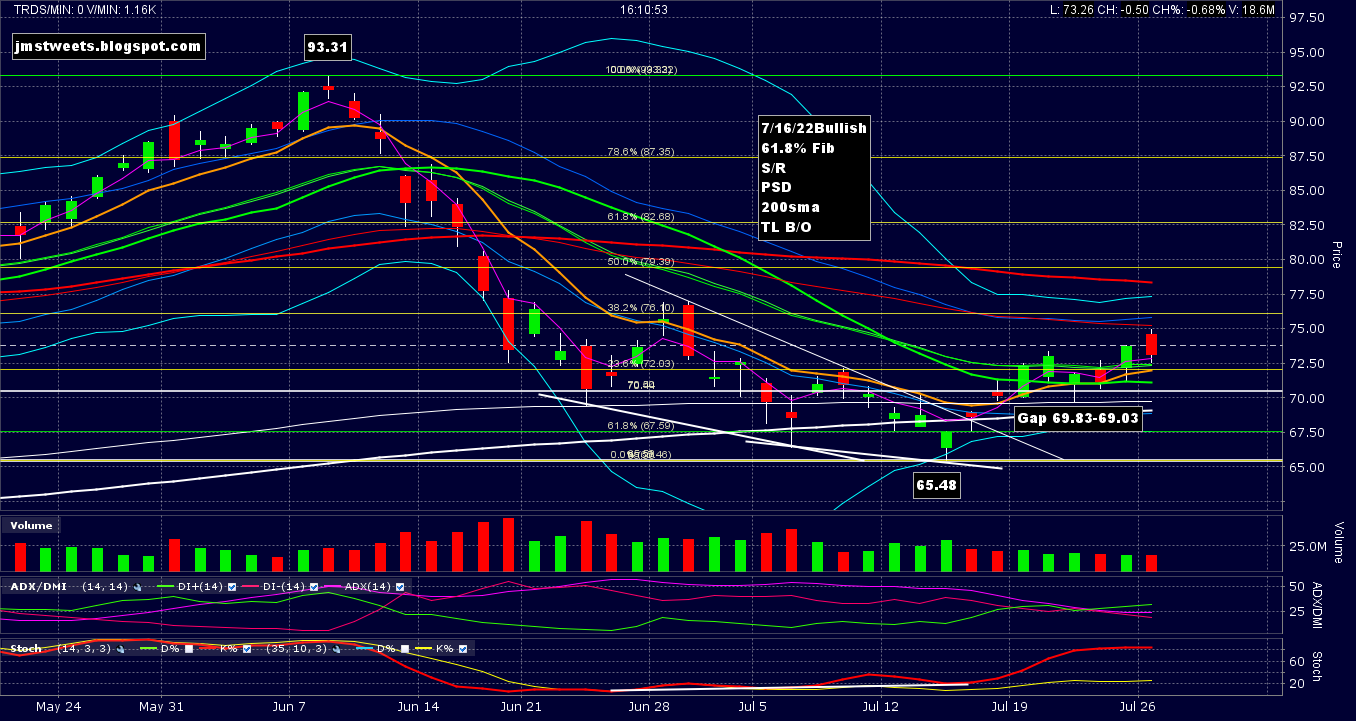
Today's price action is both good and bad. 

Its good because we gapped up at the open. We made a higher high and a higher low. We closed above the 8ema, and also the 3ema.

Its bad because we gapped up on high Stochastics. This could be interpreted as an "Exhaustion Gap".  Exhaustion Gaps can indicate an end to the current trend, which would mean price starts heading down from here. We also came close to forming a Dark Cloud Cover candlestick pattern. Such a pattern can also indicate an end to the current trend.

A Dark Cloud Cover needs to close below the 50% midpoint of the previous candle. The endpoints of the previous day's candle body are 72.13 - 73.76. The midpoint is (72.13 + 73.76)/2 = 72.95. The endpoints of the previous day's full candle are 71.27 - 73.83. The midpoint is (71.27 + 73.83)/2 = 72.55. Today's close was 73.09, so technically we did not form a Dark Cloud Cover candlestick pattern. 

If you look at the red candle from 7/22/22 and the green candle before it, you'll see a valid Dark Cloud Cover candlestick pattern. However, even though that was on high Stochastics, we continued upward this week. Another example of the same thing are the candles from 5/31/22 and 5/27/22. You can see them on the chart above.

After considering what was on the chart at the end of the day today, I decided to hold the position.

Monday, July 25, 2022

Energy May Be Turning On - Update 3

XLE Daily


We recovered well from the little dip. Today and the previous candle both made higher highs and higher lows. We haven't closed below the 8ema since we entered the trade. And we have a relatively clear path to the 50sma Target.

Short term Stochastics are high, but if you look back to May 17th through June 10th, you'll see Stochastics pinned near the top as price continued higher. So, this can happen again.

We may encounter some resistance at the previous swing high around 77 on June 29th. But the 50sma (our Target) is gently sloping down. So it may be close to the 77 level anyway.

We made a nice green candle today and the trade is on.

Thursday, July 21, 2022

Energy May Be Turning On - Update 2

XLE Daily


We were doing so well, but today we took a dip. We created a lower high and lower low for the day, which is not what we want to see. Also, Stochastics are knocking on the door of the oversold level.

However, we managed to crawl back and close above the 8ema and the 20sma. So, I think we're still good. At least to hold overnight tonight.

The 50sma Target closed at 78.66, so we left our 78.50 Target unchanged.

Tuesday, July 19, 2022

Energy May Be Turning On - Update 1

XLE Daily


Today's price action was an excellent confirmation we're on the right track. Look at today's candle. The Open was 70.06 and the 70.04 low was immediate and negligible. The Close was 72.32 and the high was 72.50. Very close to the Close. This shows XLE was on a mission to climb today.

We opened right on the 8ema, penetrated the 20sma, and closed well above it. Combined with yesterday's Doji candle, we formed a Left/Right Combo candlestick pattern, which is Bullish.

Also, the ADX did a Bullish cross. Plenty of room before Stochastics become overbought.

The 50sma closed at 78.95, so didn't need to change our 78.50 target.

Bottom line, we had a very Bullish day. Our September 75 Call increased from 3.05 to 3.60. That's a .55/3.05 = 18% increase. Looking good!


Monday, July 18, 2022

Energy May Be Turning On

XLE Daily


XLE looked bullish enough this morning to go long. Got a XLE Sep 75 Call for 3.05.

Here's what I see:

  • Bounce off the 61.8% Fibonacci level
  • Bounce off Support/Resistance level around 65.50
  • Positive Stochastics Divergence
  • Bounce off 200sma
  • Trend Line Breakout
  • Close over the 8ema
Set the Target to the 50sma at about 78.50. This will need adjustment as the 50sma is slowly descending.

Set the Stop to just under the 65.48 swing low at 65.36.

I'll look at the risk/reward in terms of the stock rather than the complicated theoretical estimate of the option:

Risk: 70.36 - 65.36 = 5.00
Reward: 78.50 - 70.36 = 8.14
R:R = 8.14/5 = 1.628:1 Not very good but its a rough estimate and fixed maximum loss.