Tuesday, December 31, 2019

NFLX due for a dip? Update 5


It's 11:43am ET 12/31/19 and you can see price has filled in the 320.80 - 324.18 gap and touched the 38.2% Fib retracement. These can act as support. 

But the 50% Fib would be more likely and stochastics are still high, although no longer over bought. I also noticed a lower gap at 304.21 - 306.60 as shown on the chart. These can attract price lower.

So here's what I'm doing. If we close at or above yesterday's close at 323.31 we will form a bullish engulfing pattern as well as be closing over the 8ema. If that happens I want to get out and look for a signal to re-short NFLX. If that doesn't happen then I want to stay in for a likely lower move.

To accomplish that, and not have to handle it in real time at 4pm on New Years Eve Day, I entered a conditional day market order to sell the put spread if 2 conditions are met:

1) Price of NFLX is greater than or equal to 323.31.

2) The time is greater than or equal to 15:55:55 today.

*** 4:05pm UPDATE: I made a mistake. I posted 323.31 as yesterday's close, but that's not what I was thinking. I was looking at yesterday's open (329.08), not the close. I made an even worse mistake. I copied the 323.31 from this post into my actual order instead of the 329.08 I intended. So my order triggered at 3:55 and exited my position. Not so bad really. I'll see what to do to now on Thu.

Monday, December 30, 2019

NFLX due for a dip? Update 4


Looks like we did reject the 61.8% Fib extension of the last up swing (green range). We rolled over and closed today below the 8ema. We also started filling the gap shown on the chart. Stochastics are still high so we have plenty of room to continue down.

I expect to continue down to at least the 50% retracement of the recent up swing (338-+292.02)/2 = 315.01. This is also below the gap and near the 20 DMA, as well as the previous swing high. Seems like a good target.

March 2020 Wheat Update 22


Didn't get back in today after last night's overnight trading hit my stop for break even. You can see it opened gapped up, continued up until it rejected off the channel upper trend line and Bollinger Band. Its also in the area of 2 different 27.2% Fib extensions. So its getting a little stuck in this area, and with high stochastics. But it was also supported at the 3ema today and did not venture further down to the 8ema. This is a sign of strength.

It could go either way from here, so I'm going to sit on my hands and wait for an edge.

March 2020 Wheat Update 21

12/30/19 Overnight trading last night hit my stop and reversed back up to the top of the channel. Since this could be resistance and stochastics are overbought (>80), I'm going to be a little cautious and wait to see how price performs today.

Friday, December 27, 2019

March 2020 Wheat Update 20


Woke up this morning to find the 554 1/2 buy stop was hit overnight. The chart above was captured at 12:40pm ET. Nice position to be in.

However, price touched my original target of 561 today (27.2% Fib extension on the green range) from my original posting on Mar Wheat back on 11/20/19, which could be a resistance level or worse, this is all we get before a significant downward retracement. 

I also see a channel upper trend line just above us at about 562 1/2, which coincides with the upper Bollinger Band. And the stochastics are just entering overbought territory again above 80%. Plus today is a Friday.

So, for good risk management, I increased my stop loss to break even at 555 1/4. If it gets hit today before the market close, I still have room to the current target of 573 to get back in next week.

Notice volume has been increasing during this 2 day break out to the upside. That's bullish. And the last 2 swings had a move of over 40 points, as shown in yellow on the chart. If we get a 40 point move this time it would put us at 538 1/2 + 40 = 578 1/4. So there's reason to plan on hitting the 573 target. Really hope the tightened stop  doesn't get hit today. But I think its the smart move at the moment for the reasons I stated above.

Bottom Line: I'm long from 554 3/4, with Stop Loss at 555 1/4, and Target at 573.

Thursday, December 26, 2019

March 2020 Wheat Update 19


I've been waiting on Mar Wheat to hit my 554 1/2 buy stop for days. Now that its popping up I want to double check my entry level and see if I want to adjust it. 

The chart shows a thick white vertical line representing the recent down leg. Where would an entry be that gives good odds this will be a break out rather than a temporary retracement followed by resuming the down  trend? 50% retracement is pretty standard and I'd say it doesn't give us an edge. I'd have to say the same about 61.8%. 78.6% is less common but still not enough to be convincing. So something above the 78.6% (553 1/4) might be a reasonable retracement to get back in. Really, the best is over the top of the swing (557 1/4). Just so happens by coincidence my original buy stop at 554 1/2 is just over the 78.6% level (553 1/4). I originally got that level because it was just over the high of the first candle to close below the 3ema. So, I'm going to be a little aggressive and keep that buy stop.

Today's (12/26/19) move already took out the 50% and 61.8% levels. And it was with decent volume even though we're in the holiday period, which seems bullish. So, even though I'm giving up a couple points waiting for the 78.6% level to be breached, its worth it for the added probability this is a break out move and we're back on track to reach the 61.8% extension of the yellow range (573 1/4).

However, we didn't hit the 50% retracement of the recent up leg (purple range), nor did we fill in the gap at 534 3/4 - 533. So I'm still not convinced yet this isn't just a retracement before more downside.

Bottom line, currently have a live order with a 554 1/2 buy stop and a 573 target.

NFLX due for a dip? Update 3


NFLX closed just under the 3ema today on very low volume. Its barely bearish, but it looks like we could be rejecting off the 61.8% Fib extension of the last up swing (green range).

Still holding the put spreads and monitoring.

I smell bacon - Update 2


My updated stop loss was hit 8 seconds after the open this morning. sold for 5.35. A loss of 5.35-6.30=.95*$400/pt=$380. Sad but better than the hopium strategy.

This doesn't invalidate any of the previous analysis, it's just alternative reality against the better odds. Anything is possible at any time. I think its part of why trading can be so captivating. Like a golfer always improving their swing, or a surfer always trying for the perfect ride. As long as the element of surprise and risk of a mistake are present, an endeavor can keep our interest.

So for this trade, we could break out of the current down channel and climb significantly to a AB=CD pattern, or reject off one of the 6 possible resistance levels I mentioned in the Update 1 post and start downward to the other side of the channel. Just have to watch and look for an opportunity.

I smell bacon - Update 1


I don't like how bullish this little cup looks bouncing off the 8ema and neckline with a close near the high after several doji's. We may just pop up to the 61.8% Fib or the downward trend line or the 200 DMA = 76.4/78.6 Fib = Bollinger Band, then come down. 

I can hold on though a pop and see if we peak and retrace, but each point is $400 on this contract. And what if we don't retrace quickly? I think the smart thing, given the risk, is to get out quickly on a pop and take the smaller loss, then get back in when we see a rejection of a resistance level.

So I entered a conditional market sell order for the HE Apr .76 Put Option if the Apr HE Futures contract Bid/Ask hits 78.36, which is just over the recent high on 12/17/19.

There are a number of more sophisticated orders than a simple Market order but they all could result in a no fill, which could be worse than a sloppy fill.

Tuesday, December 24, 2019

Gold is at an inflection point.


Gold chart patterns look better to me on the weekly chart. This is a weekly chart above. Gold looks like its breaking out of a down channel and beginning a 3rd drive up. If so, you can see 3 possible targets, 2 based on Fibonacci levels and 1 from a harmonic measured move. They are approximately 1600, 1621, and 1647 with timing projection of mid-March 2020.

Or, what we are seeing is a false break out from the down channel, and price will re-enter the diown channel and go down at least to the 50% Fib retracement at 1432.

I'm just monitoring it at this point until the current inflection point is resolved to one direction or the other. 

Monday, December 23, 2019

I smell bacon


April Lean Hogs looks like a short. I got a Apr 76 Put for 6.30000. Lena Hogs futures have a value of $400 per point. So 6.3 * 400 = $2,520. My current target is 70.50, although I will probably raise that to 72. My stop loss is if the futures price hits 81, which is just above the 200 DMA and the other lower resistance areas.

So let's say price drops and I get out at 72. That is 5 points under the current futures price of 77. Let's say there's a 57% Delta on the option. (The Delta for an option 5 points ITM right now is 57%). The profit would be about 4 * $400 * 57% = $912. If price goes against me and reaches my stop at 81, that's 4 points over the current price of 77. But the Delta will be less. The  Delta for a current option 4 points away is 36%. So the expected loss would be 4 * $400 * 36% = $576 loss. So the Reward:Risk would be 912:576 = 1.6:1, not great but given the absolute dollar value of the possible win plus the good odds of a win based on the technical analysis below, its acceptable.

The yellow thick lines represent a Head and Shoulders topping formation. The higher yellow vertical line shows the distance between the head and the neckline. The lower vertical line is an exact copy placed under the neckline at the break out point as a projection for where the down move will reach. That price objective is 69.90. This also lines up nicely with a previous low around Aug 6th, as marked with a red line.

I also marked a downward channel price has been in since about Oct 15th. If price hits the lower trend line of the channel it'll probably be around 69.90. And we're currently near the top of the channel, so that controls how much we need to risk if we break out to the upside and increases the likelihood of heading down to the other side of the channel.

We've already had 2 drives down marked with thick white angled lines. The second white line is a copy of the first but moved down to line up with the top of the second swing down starting 11/13/19. If we start a down leg from where we are today, then the 3rd white line will be starting in the right place and projects down to about 70.50.

Price is also under the 200 and 50 DMA's, which is generally bearish, and Stochastics are over 80% which suggests we might be near a swing top.

Price is retesting 3 different resistance levels, the Head and Shoulders neckline, the 50 DMA, and a horizontal Support and Resistance line at about 78.40, marked on the chart with a red line near the neckline.

Price has been consolidating between the 50 DMA and the 8 EMA as well as between the 2 support and resistance lines I mentioned. Eventually it will probably break out either up or down. All the above observations suggest it will be to the down side.

Finally, the high price of the current consolidation (78.30) is between the 50% and 61.8% retracement of the recent down move from 83.00 to 71.90. I didn't show it because the chart is already too busy. Its easy enough for you to draw it on a chart if you want to verify it.

Saturday, December 21, 2019

Technical Analysis beats fundamentals or headlines

During this past work week, 12/16/19 - 12/20/19, a major news item came out. I'd like to point out how equity markets reacted.

The US House of Representatives voted to impeach the President of the US. This is only the 3rd time in history this has happened. Our current President is considered to be very business friendly. For example, he was behind deregulation and tax cuts to stimulate business. He's been pressuring the Federal Reserve to lower interest rates to stimulate business. He's been credited by many for the historical length of the bull market in equities. So given that and more to support American business, what reaction would you  expect from the impeachment vote passing? I know the Senate has a Republican majority and won't remove the President from office, but still an impeachment process has to be considered a negative relative to consumer sentiment, which is close to 2/3 of the economy. So which market move would be the most logical and likely, up, down, or sideways?

Of course, the market should have dropped significantly on this news. But no. Equity markets climbed like crazy making new highs. So bad news, and the market had a melt up.

This is a good illustration why Technical Analysis beats Fundamental Analysis over the short run. I've seen a good reaction to good news and a bad reaction to good news. I've seen a bad reaction reaction to bad news and a good reaction to bad news. I've seen the stock of companies with a ridiculously high P/E continue to move up for years (AMZN for example). My point is, you cannot trade on a short term basis based on a reasonable reaction to news and fundamentals.

Meanwhile, Technical Analysis is very well defined. You can measure the percentage of occurrences of a pattern when it worked as expected. Even though fundamental traders often poo poo TA, I am very comfortable with my preference for a math, geometry, and statistics based methodology.

As one of my favorites trading guru's, Larry Pesavento, says "trade what you see, not what you think".

Friday, December 20, 2019

NFLX due for a dip? Update 2


Another day another move closer to the 61.8% Fib resistance level. Still holding the Jan 320/310 Put Spread, which dropped in value today by about another $70. Can't worry about that, the important thing is we have fixed risk. Risk is limited to the $355 cost of the Put Spread.

Also marked on the chart a Gap between yesterday's low (324.18) and the close the day before (320.80). Notice the 8ema will coincide with the bottom of the gap in a day or 2. That will make a good natural target if we get a reversal in the next couple trading days. We'll see.

If you want to see a legend of the chart indicators, check my profile.

March 2020 Wheat Update 18


It's 7:25am ET and overnight trading hit my 544 stop and took me out with a 543 3/4 - 535 =  8 3/4 * $50/pt = $437.50. Add that to the $325 on 12/6/19 for $762.50 profits per contract so far. 

Now what? Based on all the analysis in the previous posts I still think we'll make it to the 61.8% Fib area 573 - 589. So I want to get back in long, but when there's a good technical reason. I added a downward trend line on the high's of the past 3 candles. Look how perfectly it lines up. If price breaks through the that trend line and goes higher than the high of yesterday's candle (553 1/2), it will be worth the risk to go long again. The risk is that its a false break out and we reverse and head back down.

So I entered a Buy Stop order this morning at 554 1/2 with a target of yellow range 61.8% Fibonacci extension at 573 and a Stop Loss just below the current overnight's low at the 8ema (542). That turns out to have a Risk of 554 1/2 - 541 = 13 1/2 * $50/pt = $675 and Reward of 573 - 554 1/2 =  18.5 * $50/pt = $925 , Risk:Reward = 675:925 = 1:1.37. Not great but I think the odds are good and the $675 risk is covered by the  $762.50 profits to date.

Thursday, December 19, 2019

March 2020 Wheat Update 17

Came within 1/4 point of my stop but didn't trigger it. I'm still in the trade but expect to be taken out in the after hour trading.

NFLX due for a dip? Update 1


NFLX broke through and closed above the 200 DMA and the 27.2% Fib extension, and closed near the top of the candle. This is all bullish, but price is quite stretched here compared to the previous waves since the 9/24/19 bottom and the stochastics.

We're approaching the 61.8% Fib extension for the green range and the yellow range. (Colors aren't significant, they're just to distinguish between 2 ranges.) This is a common area for a reversal, so I'm holding onto the Jan 320/310 Put Spread, which dropped in value today by about $100.

Did I mention this is a high risk trade, and I wouldn't recommend it? At this point I'm thinking I should have taken my own advice.

Wednesday, December 18, 2019

NFLX due for a dip?


This is a high risk trade. I would not recommend anyone take this trade. However, I the odds look worth the risk to me. I got a NFLX Jan 320/310 Put Spread for 3.55 today 12/18/19 at 11:56am ET. 

The Earnings Report is 1/21/20.

What makes me think its a shorting opportunity is:


  • Hitting the 200 dma
  • Hitting the 27.2% Fibonacci extension off the most recent swing
  • Its far from the 3ema
  • The stochastics are over 80%
  • Exhausted its harmonic move
  • Closed slightly over the Bollinger Band

I'll figure out the 50% retracement after I see enough price action but in the meantime, I placed a limit order to sell the Put Spread at 9.90 because its a 10 point spread.

March 2020 Wheat Update 16


I kept my stop where I set it yesterday at 544. Today's low was 545 1/4. Very close but didn't take me out. The daily candle closed red and near the bottom (bearish), but not under the 3ema (bullish).

Its normal after this big move and hitting the 27.2% Fib extension, AB=CD projection, and a channel trend line, with high stochastics, that there'd be some profit taking and a pull back. But I keep more of the paper profits on this pull back than the last one.

We might be going down to test the 8ema or fill that little gap at about 533-535, or further. So even though I still we're going higher, I'd rather capture some profits and sit out the dip looking to get back in than ride it down to a close below the 8ema, which is my normal exit.

I added 2 parallel upward sloping white trend lines by drawing the first one connecting the lows then copying it and positioning it at the highs. Its always amazing when they line up so well like this. Now you can see yesterday's high stopped right on it.

So bottom line, I'm going to leave my stop where it is and see what happens tomorrow.

Tuesday, December 17, 2019

March 2020 Wheat Update 15


Today we had a gap open. Price came down, filled the gap, and tested the 3ema, then went went back up and after making a slightly new high, closed near the high. And the close is higher than yesterday's close. Also, the big green candles for the past few months have been followed by some red candle profit taking but that's not true for yesterday or Thu 12/12/19. We've only gone up since 12/12/19. That is all bullish price action but I did see some yellow caution flags. 

Both yesterday's and today's highs look like they're encountering some resistance at the 27.2 Fib extensions. And today's high is higher but is very close to yesterday's high. Today's volume is lower than yesterday. We closed over the Bollinger Band again, and stochastics are just entering the overbought range. We're also near the top of the AB=CD pattern. Today's candle could pass for a Hammer Candle. That is all not so bullish.

If our chart is bullish enough to warrant moving our target up (see yesterday's posting) then I'd say tomorrow's price action should not go below today's low. If it does and closes with a red candle, then we have an Evening Star with relatively high stochastics. That's a full fledged red flag. If that is followed by a close under the 8ema then we are likely to have another multi-day dip. Plus there's a little gap 533 - 534 3/4 which will want to get filled on a pull back.

So my response was to raise the stop to just under today's candle low (545) to 544. If the stop gets hit, I'll be looking for a good place to get back in a long trade.

Bottom line is the target is 572 and the stop loss is 544.

Monday, December 16, 2019

March 2020 Wheat Update 14


As I mentioned last time, if we close with a green candle today we'll have a Doji Sandwich, which is very bullish. We also opened with a Doji Gap UP which is also very bullish. Plus we had strong volume today giving the move more credibility. If you're long, that is one beautiful pattern!

Additional good news is stochastics are not yet over 80%, so for my criteria, not overbought.

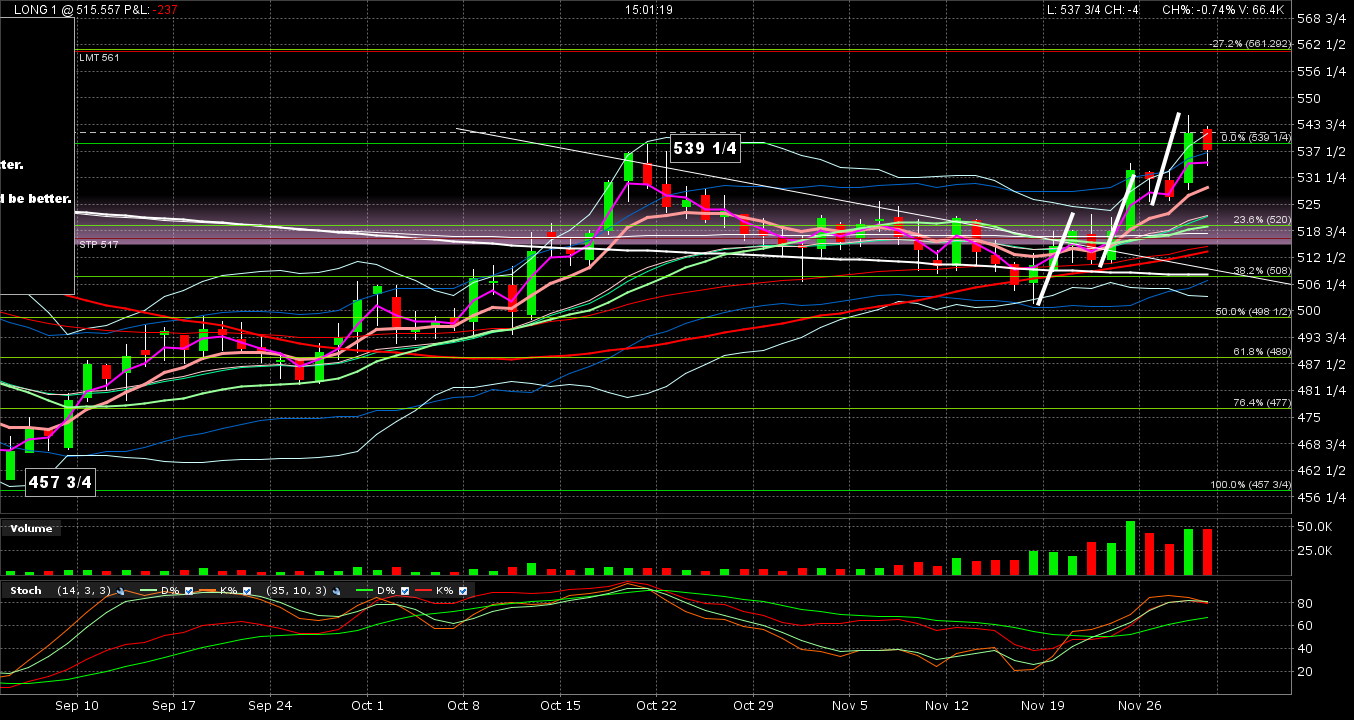
If you take these factors plus the ones I mentioned in Update 12, there is a good chance price action will go higher than the current target at the yellow range 27.2% Fib extension. Other higher targets I'd consider is the green range 27.2% Fib extension (561, the original target), yellow 61.8% Fib extension (573 1/4), and the green range 61.8% Fib extension (589 1/2).

Before picking one, I want to take a look at past resistance. Here's a longer term chart that shows that:


I can see important resistance around the 573 1/4 yellow 61.8% Fib extension. Price could cut right through it, but we don't know what will happen there and stochastics could be overbought by the time price reaches that level, so it should be respected at this point. So now I'd rule out the green 61.8% Fib at 589 1/2.

The green 27.2% Fib extension is so close to the current target its not even worth the risk of raising the target.

So that leaves us with the yellow 61.8% Fib extension. Its 573 1/4 but I'll reset the new target to 572 to account for the Bid/Ask spread and the occasional market practical joke of missing a likely target by just a few ticks.

I also raised my stop to just over break even at 536. I had entered at 535.

Here's another analysis. See the green angled trend lines from Sep/Oct? They are equal. The one on the right is a copy of the one on the left and moved up so it starts at the swing low. I drew it there to project the possible AB=CD move. As it urns out the price action went higher. I was taught that expansion is usually a Fib extension. Let's find out and use the same expansion percentage for our second yellow angled trend line to get a possible new target.

Left green line = 498 3/4 - 457 3/4 = 41 points (those have been written on the chart). The second green angled trend line = 539 1/4 - 482 3/4 = 56 1/2 points.

(56 1/2) / (41) = 1.378
which is pretty close to
a Fib 1.272 expansion.

The left yellow angled trend line = 546 - 501 3/4 = 44 1/4 (those have been written on the chart too).

44 1/4 x 1.272 = 56 1/4
Our current swing low is 516 1/4
516 1/4 + 56 1/4 = 572 1/2

What do you know, that's exactly the new target I picked above! I swear I picked the target before I did this trend line expansion symmetry analysis. This is a very nice confirmation.

Of course, anything can happen, and if price hits the first target (557 3/4 or 561) and reverses before hitting my new target (572), it will be very disappointing. But there are so many indications price action will go higher than my conservative current target, it a good trade to increase the target.

One thing that concerns me is we closed over the Bollinger Bands today. But looking through history for this contract I see there have been continued trends after closing over the BB in the past.


Friday, December 13, 2019

March 2020 Wheat Update 13


The most stereotypical price action every trader knows. Price opens, goes up just enough to trigger your buy order, then plummets. I was looking at >$400 paper loss per contract. Unpleasant but so typical it was laughable. The day closed with a paper loss of -$127. I had entered a buy-stop at 535, like I mentioned yesterday, with a conservative target of 557 3/4 and a tolerant stop loss at 515.

If the stop loss was triggered it would be quite painful, but I believe the odds are much greater price will hit the target than the stop loss and I don't want to get shaken out due to a stop loss that's too tight. So I busied myself with other trading and tried not to watch the market bully me. But I couldn't help taking a look once in a while. I wanted to laugh, cry, and get angry but I just shook my head and thought leave it alone.

Notice it went down and touched the 8ema then bounced back up and closed as a doji, well above yesterday's close. That's actually better (more bullish) than I expected for today, as you can see by reading yesterday's post.

If we get a green candle closing above the doji on Monday, we'll have a "Doji Sandwich" which is a strong predictor for more bullish action. If we get a red candle closing below the doji, and therefore under the 8ema, we'll have an Evening Star, which is a strong predictor for more bearish action, although it would be somewhat muted because stochastics are in the mid-range. 

So, Monday will be very important to this trade. 

Thursday, December 12, 2019

March 2020 Wheat Update 12


I think we're back in business. But probably not tomorrow. If you look backward on the chart you'll see almost every big green candle is followed by 1-3 red candles, then the trend starts back up. I don't know if that will happen this time or whether we just shoot straight up, but I want to give the typical red candle a chance so I can get in lower.

Look from where we bounced. Look at the yellow Fibonacci levels. You'll see we bounced off the 61.8% at 518 3/4. That's textbook. At that same level is the 50 DMA. Its also the 23.6% Fib level on the larger range, in green color. You have to go to an earlier chart on the blog to see the full range for the green colored Fib's.

Today's candle is a Bullish Engulfing Candle and it closed well above the 8ema on high volume.

Also, notice how the stochastics came down to mid-range from the candle high on 11/29/19 at 546. Its rested and reloaded and has room to get us up to the original target at the 27.2% Fib extension before its very overbought.

All of this is very bullish and I want to get back in, but I also want to be disciplined and see if there's a day or two of pull back. If tomorrow we surpass today's high I'll get back in. In fact, before tonight's open at 8pm ET, I'll enter a stop-buy order at 535 (just over today's high of 534 1/4) so I don't miss the entry if I'm busy.

This chart pattern is what I expected, which you can see in previous posts, but it wasn't guaranteed. We could have gone much further down. So I had to get out and wait for a reversal, which now looks likely.

P.S. If you want to see what indicators are what colors on all my charts, refer to my profile for an explanation.

Friday, December 6, 2019

March 2020 Wheat Update 11


As you can see, price action dipped down, which hit my stop order at 522. 522-515 1/2 = 6.5 points x $50/pt = $325 per contract. As a percentage of margin 325/1656.25=20% which isn't bad in 16 calendar days. But I can't forget the unrealized profit at the peak on 11/29/19 was 546-515 1/2=30.5 x $50/pt=$1,525. 

Today formed a Doji candle which connotes indecision. Certainly not a conviction of sentiment to the short side. Also, we went down to the 61.8% Fibonacci retracement at 518 3/4 (the low was actually 519 3/4 but close enough for trading purposes) . This is often the end point of a retracement, but doesn't have to be. We're still north of the 20, 50, and 200 dma. These give reason to watch for a move back up as early as Monday.

However, stochastics are only mid-range (not oversold), we closed under the 8ema,  and the 3ema is below the 8ema. This tells us we have to consider the odds are still to the downside. We can certainly see a deeper correction to a level mentioned in yesterday's update .

So, now that I'm out, I'll just watch how things develop and look for an opportunity. Not enough justification to enter long or short.

Thursday, December 5, 2019

March 2020 Wheat Update 10


OK, things are getting more bearish. Looks like just another consolidation day, but there are some danger signals.

Today's candle creates a Bearish Engulfing pattern.
The 3ema crossed down over the 8ema.
Candle closed near the bottom of the candle.
Candle closed well under the 8ema.

And Stochastics have a lot more room before they are oversold.

While we can certainly still go upward from here, I think the odds have shifted to the downside. But the low of today is a little higher than the yesterday's low. And the 50% Fib can be a little sticky for price. 

So, rather than just exit the trade, I moved up my stop loss up from 517 to 522, which is one tick (quarter point) under yesterday's low. I POSTED THAT ON TWITTER 13:28 ET TODAY.

The stop loss was not hit before the market close, so I'm still in. The stop is so close that overnight trading can take me out. But if the stop is hit then I'll start looking for an opportunity to get back in long.

I see several potential bottoms for this swing. Here they are in order of closest to furthest:

20 sma
Yellow 61.8% Fib (also 200ema)
50 sma
Yellow 76.4% retracement (not an actual Fib ratio but a popular misnomer)
Yellow 78.6% Fib
200sma (also trend line, Green 38.2% Fib, and Keltner Channel
Bollinger Band

It would be very surprising if price went all the way to the bottom of the previous swing low. Of course, anything is possible.

I'm hoping it will bounce back up tomorrow but hope is not a strategy. I have to accept the odds have shifted to the downside after today and take protective action.

Wednesday, December 4, 2019

March 2020 Wheat Update 9


We had a doji candle most of the day but we ended with a candle body bigger than what looks like a doji. However, its very small by comparison to recent candles. I think the market is taking a bit of a breather today to digest the current action. 

Today's candle closed right on the 8ema with a green body. Certainly more bullish than a further down move. That's a little encouraging. Also yesterday's candle closed 525 1/4 which is where today's candle opened. So the 2 candles combined form a Bullish Harami pattern. This is encouraging, but would have been better if we closed over the 8ema, so its not an actual buy signal.

I added the large yellow angled lines to show a AB=CD pattern. It takes us up to the 561 target at the 27.2% extension of the original trading range shown with the green Fib lines. You can see there's another 27.2% extension now from the more recent yellow Fib range. This offers some confirmation of our target, although its a little lower.

We may get some more little candles around the yellow 50% Fib level at 524 before a clear direction decision is made. Of course, I'm hoping for a big up day as soon as possible, or at least a close above the 8ema. We could certainly go lower, but I think the odds are to the upside. I'm still holding.

Tuesday, December 3, 2019

March 2020 Wheat Update 8


Ugly enough for ya? Yesterday's post said we might have a "3 drive to a top" pattern, and if we do we can expect a 50% or 61.8% pull back. I drew in yellow Fibs from the high to the bottom of the current up swing. You can see we hit the 50% retracement exactly. 

The close below the 8ema should be handled by watching the chart at the open tomorrow. If we start down again, we should get out and look for a place to get back in. However, the top candles do not make a sell pattern. And today's candle is relatively large. You can see in the recent past, big candles are faded the next day. If I knew today's action yesterday I would have sold and looked to get back in, but there was a good chance we could have continued up today, and I didn't know what would happen, so I had to stay in. I'm still in.

Tomorrow we could see a reversal back up with the trend, or we could continue down and hit the 61.8% Fib then reverse back up, or worst case is continue all the way down and hit my stop at 517, which is 2 points over my entry at 515. If I get stopped out I'll watch for a re-entry opportunity.

I'll admit it was painful to watch $1,000 evaporate today, but I still believe in this pattern, and until another day closes under the 8ema, I don't think its been invalidated. Just have to trade what the market gives us tomorrow.

Monday, December 2, 2019

March 2020 Wheat Update 7


Previous trading day we closed over the Bollinger Band. This is an extreme condition which often leads to a pull back. We got a bit of a pull back today, but we closed over the 3ema and did not form a candle sell pattern. These are bullish reasons I'm staying in.

However, a couple things look possibly short term bearish. The Stochastics(14,3,3) has a slight down slope while the previous 2 candles made a higher high. This is a Negative Stochastics Divergence, and can be bearish. The other thing is we may have made a "3 Drive to a Top" pattern as shown by the 3 thick white angled lines. If so, then we can expect a 50% or 61.8% retracement.

The bearish things happened over the Thanksgiving holiday, so maybe they aren't very reliable in this instance.

Bottom line, I'm holding on unless we close under the 8ema with confirmation the following day. or we hit the Stop Loss currently at 517.