Monday, December 28, 2020

Thor Industries, Inc. Weekly Bullish Gartley - Exit


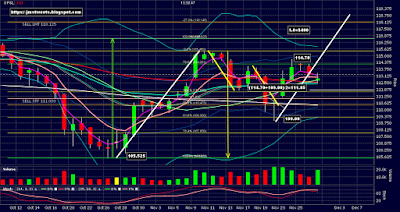
The top chart is the Daily, the bottom chart is the Weekly.

Today we opened with a gap up. Looks like profit taking got a little carried away. The Daily created a Bearish Engulfing pattern on high Stochastics and closed under the 8ema. It also hit my stop at 98.38 and exited with a little slippage at 98.28.

The Bearish Engulfing pattern on the Daily followed a double Doji and a Negative Stochastics Diversion. We're also about to enter a new phase going into January. This chart from 2008 - 2018 doesn't add any confidence:


Jan 2019 was an up month and Jan 2020 was a down month to complete the picture but the S&P 500 is currently very overbought.

Now, on the Weekly, THO is not yet overbought nor has it closed below the 8ema. So the Bullish indications that got us into this trade have not yet been violated. If we were trading on the Weekly chart we should still be in the trade. However, we would have needed a much lower Stop and therefore a much smaller position in order to control the risk. And the setup looked so good, I didn't want to go in that light. Options would have been a good solution but the options on THO are terrible in terms of liquidity and Bid/Ask spread.

So, the bottom line is that being stopped out of this trade, with the current price action, is better than holding on. I suspect this will bottom out on the Daily relatively quickly and start back up, unless the overall market starts to tank.

We'll monitor the THO chart and look for an entry for a new long position.

Summary:

Enter: 102.75
Exit: 98.38

98.38 - 102.75 = -4.37 * 50 shares = -$218.50 into the Loss column.


Corn Cup Forming - Exit


The top chart is the Daily and the bottom chart is the 3 minute.

On the Larry Pesavento internet show on TFNN this morning Norm Winski warned of a significant reversal in grains tomorrow after the close. You can see it for yourself by going to minute 41 at:

https://www.youtube.com/watch?v=HHH4i_IIvR8

This hyper-sensitized my caution with this Corn trade. So, at 2:00pm ET I went to the 3 minute chart and started trailing a Stop, with the intention to exit before the close at 2:20pm one way or the other.

I ratcheted up the Stop through a few levels but none were hit and there was less than a minute left before the close. At 14:19:51 I hit the Bid and sold out at 456 5/8. You can see the original Target on both charts at 468 1/2 just under the 27.2% Fib extension. We may well still hit that, maybe as soon as tomorrow before the close, but that seemed a little too perfect to base a trade management decision on. If we do hit the original target it may not be for several days or weeks, or even longer. And who knows how big the draw down would be.

We could have waited to see how trading went tonight and tomorrow morning since Mr. Winski's reversal time was after the close tomorrow, but we only have 1 mini-contract on, so we can't scale out. Plus the potential down turn could begin early. Wanted to manage the exit while I could, not find an unwelcome surprise when I woke up.

So, in summary:

Entry: 427 1/2 on 12/16/20
Exit: 456 5/8 on 12/28/20

456 1/8 - 427 1/2 = 29.125 * $10/pt = $291.25 call it a win.

If it was the full size ZC contract the profit would have been 29.125 * $50/pt = $1,456.25

Corn Cup Forming - Update 7


Been continuing to trail our Stop behind the low of 2 closed candles back each day. Starting today I'm changing the Trailing Stop to just under 1 closed candle back.

So, the last trading day was 12/24/2020 and the low was 446 1/2, so I just moved the Stop up to 446.

I tightened the Stop because we're very overbought, we've had an unusual number of green candles in a row, I'd like to capture profits in this calendar year, and tomorrow is a full moon. There seems to be a body of evidence and many successful traders that show there is a significant correlation between trend reversals in the grain markets and full as well as new moons.

Here are some very intelligent, successful traders with followers who are convinced of this correlation:

Tim Bost (www.timbost.com)

Norman Winski (www.astro-trend.com)

Shane Smoleny (www.wolftraderfutures.com)

Bill Meridian (www.billmeridian.com)

Arch Crawford (www.crawfordperspectives.com)

Thursday, December 24, 2020

2 Gartley's on a Mar YM 3 Minute


Check out these 2 back to back Gartley Patterns on a 3 minute March YM futures chart. Both were successful scalps using a 61.8% retracement of the AD range as the target.

Larry Pesavento's book "Trade What You See" says the Gartley Pattern is successful 70% of the time.

Note these are not rigorous Gartley's as far as Fibonacci levels. It may be better to call them XABCD patterns.

Wednesday, December 23, 2020

Corn Cup Forming - Update 6


Same comments as yesterday's post. Holding the Target at 468 1/2 with a Stop at 430.

Thor Industries, Inc. Weekly Bullish Gartley


The top chart is the weekly. The bottom chart is the Daily.

I normally have been trading futures rather than stocks but last night on CNBC's "Fast Money", Guy Adami called out Thor Industries, Inc. (THO) as a bullish bet. I thought I saw an Inverted Head & Shoulders on their chart. So I took a look at it on mine and found a textbook bullish Gartley pattern on the Weekly.

Also found a Twentyman Line pattern and an AB=CD Pattern with a 38.2% Fib pull back. Both very bullish.

So I'm long from 102.75 but I'm very skittish about the equity markets, so I'm setting a nearby target. There are many targets available for this trade. I'm using the 27.2% Fib extension of the green range, which is 106.63, and is near the .618AD of the Gartley at 105.02. It's also near the Gartley C point at 107.59. The actual Sell Limit order is for 106.50.


Corn Cup Forming - Update 5


It's 7:15am ET. I'm concerned that even though we're in the middle of a BB/KC break out, there's going to be a liquidation today or tomorrow due to the Christmas break. 

Also, look at how many green candles we've had in a row. Its easiest to look at the volume bars to see this. Not counting today, we have 8. I went back all the way to the beginning of this contract and the most green candles in a row is 7. The first 3 or 4 in this current sequence are Doji's, so maybe those don't really count.

If you look at the high Stochastics, the lack of a red bar, and a 4 day Christmas holiday, I want to employ some prudence. So I moved the Stop from 428 to 430, which is just below the 2nd candle back. 430 is also well below the 8ema. 

Moving from 428 to 430 doesn't make much difference, but its the beginning of trailing a Stop just under the low of 2 candles back.

Tuesday, December 22, 2020

Corn Cup Forming - Update 4


Another beautiful day in the long corn trade. We closed even further above the channel Trend Line, making a higher high and a higher low. Volume is only slightly less, but not a concern a couple days before Christmas. We're still looking bullish.

I added thick white angled lines to measure the different price cycles. They are shrinking like they usually do. The 2 longest reach our 27.2% Fib extension target. That's somewhat reassuring but we could definitely peak early and not reach our target.

Stochastics are now pegged at about 97 out of a maximum possible of 100. This always looks concerning to me, but you can see how corn has previously pegged Stochastics at the top for many days in the past. Look at this past October for example. So, we shouldn't let this lead us to getting out early.

I thought about adding to the position here, but it seems likely we'll get a pull back before hitting our target. I'll wait for the recovery after the pull back to add to our position.


Monday, December 21, 2020

Corn Cup Forming - Update 3


Today's price action is just like the previous trading day, except a little better and a little worse.

It's a little better because we:

  • Dipped down and retested the 8ema then bounced back up and closed higher than the open.
  • Closed higher than the previous candle's high. 
  • Closed above the Trend Line. 
  • Closed at a higher high (440) than the high at the beginning of the cup (439 1/2). 
  • Higher volume than the last 9 candles.
  • BB/KC breakout has begun. (See Bollinger Bands / Keltner Channel cross on chart below.)


Its a little worse because we:

  • Are even more over bought.
  • Entered an area of potential volatility.
By "area of potential volatility" I mean the area where you first breach the previous swing high of a cup formation. It's often an area of volatility. Sometimes you just punch right though it and keep running. Other times you have a false break out and start to retrace a bit. Sometimes the false break out turns out to be a double top (bad for our trade) and sometimes it starts a "Handle" in a "Cup and Handle" pattern (good for our trade). I've also seen a straight out crash from a point like this.

Overall, the odds favor a continuation upward. The BB/KC Squeeze breakout is supposed to typically last 5 -7 candles. The big question is; will we continue upward long enough to reach our target at the 27.% Fib extension. Which now is beginning to look like it will coincide with the top of the channel by the time we make it up there.


Friday, December 18, 2020

March Nat Gas Bullish Retrace - Update 2


Well, what do you do here? On one hand there is no change in the technical setup that indicates a sell. In fact, we broke up through the Trend Line and closed above it. It still looks bullish to me.

But, on the other hand, we haven't made any decisive move to the upside. We're stuck in a sideways consolidation. We're still right on the Trend Line and its a Friday. 

Even though there appears be an upward bias, the biggest influence on whether to exit or hold in this particular situation is risk tolerance. Considering the size of this contract, and the potential for crazy headline risk, I decided the best thing to do is exit near the close today and decide whether to get back in next week.

So, we exited at 2.660 and took a small loss 2.660 - 2.705 = -0.045 * $2500/pt = $-112.50. I don't like taking any loss, small or otherwise, but I prefer a small loss to being long and a gap down on the open in 2 days. I thought about taking a hedge but that's only in case there's a gap up Sunday night. But if I took a 1:1 hedge then we wouldn't benefit from a gap up anyway. Exiting the hedge at the open would be the same as re-entering at the open. So, I decided to just take a small loss. 

Count this trade as a loss. We'll try and turn it around next week.

Corn Cup Forming - Update 2


Another great day for a Long trade in March Corn. Definitely wanted to hold the position over the weekend. Looks like we're just beginning to break out of the BB/KC Squeeze on increasing volume, and Stochastics aren't overbought yet.

However, we are right on the underside of the channel trend line. We're well over the 3ema and getting pretty far from the 8ema. And we're approaching the previous swing high at 439 1/2. Each of these 3 things can cause resistance, leading to a reversal.

If we do get a reversal, it could turn into a Cup and Handle, which would be ok for our long trade, but it could also turn into a Double Top, which is not good.

Raised our Stop to break even at 428. We'll see what happens next week.

Thursday, December 17, 2020

March Nat Gas Bullish Retrace - Update 1


For March Natural Gas Futures, today might as well never happened. We kinda broke out to the upside, over and above the downward Trend Line and made a new swing high, but then we dropped precipitously. We kinda continued down below the 8ema, went below yesterday's low, but then we reversed and closed above the 8ema. So, as a result, there is no change in trend and nothing for us to do but wait for the next candle.

You might say "but wait a minute, we created a Bearish Engulfing candle where today's red body engulfed yesterday's green body". That's true, but since we closed over the 8ema, we don't want to act on that candle pattern yet.

Notice how today's volume 16,966 is greater than the past 4 trading days. I'd say that the Bears had a slight bias but not enough to decisively over power the Bulls. But it looks like a pretty good battle took place. If the Bears give up tomorrow, we could get a nice acceleration up.

Tomorrow afternoon will be a difficult call if we end with another neutral day, whether to exit for the weekend or take the risk of holding until Sunday night.

For tonight's after market trading, I'm just leaving our Stop in place and waiting for tomorrow.

Corn Cup Forming - Update 1


We had a nice constructive move today on increased volume. Stochastics are not yet over bought. The Corn Cup continues. ("Corn Cup" isn't really a thing, but a slow round curve that looks like a cup is a recognized accumulation pattern, which is Bullish.)

One thing that is concerning is the upward Trend Line we're approaching. We broke down through it around Dec 1st and now we're going to test the underside. If we reject off of it and start heading down, that would be a sign of trouble. Not necessarily a trade killer but it could be. If that happens, I'll probably move our Stop up to break even. It would be best if we blast through it and start the BB/KC expansion.

Wish today was a Monday instead of a Thursday because we have only one more candle before we have to decide what to do about the weekend, in terms of whether to hold, hedge, or exit.

Wednesday, December 16, 2020

March Nat Gas Bullish Retrace


Tempted to enter March Natural Gas futures long today, but we're not quite ready. We need to break through the downward Trend Line which is coincident with the 20sma, and close above it.

There's a risk from where we are to reject off the TL and 20sma and head back down. That's what happened the last two swing highs, and could certainly happen again. However, there is something special about 3 drives to a bottom (or top). It tends to retrace the full range of all 3 drives, which is the green range on this chart, to at least 50%.

Notice on the top chart, which covers much more time than the bottom chart, the current swing low came very close to the low on March 9th, 2020. This may represent support.

We've had 3 doji's in a row on the Daily chart bobbling between the 8ema and the 20sma. The downward Trend Line is now adding pressure to the squeeze. We're probably about to break out one way or the other very soon. But we haven't broken out yet, so its too early to enter a trade on the Daily today.

I have several indications that suggest the breakout will be to the upside. Here's what I see:

  • Bounced near previous low at 2.294, March 2020
  • Bounced after 3 Drives to a Bottom
  • Closed over 8ema
  • Unfilled Gap 2.957-2.920
  • Stochastics mid-range, providing ample runway
  • About to Break Through 20sma & Trend Line
Since we want to see a break through resistance, as described above, I entered a contingent order that won't trigger unless we hit 2.705. To prevent entering too high due to a gap up or a wide Bid/Ask spread at the market open, I added a limit price of 2.715.

Since this seems like a more risky trade, and an "expensive" contract, I'm using the QG mini-contract  ($2,500/pt) instead of the full sized NG contract ($10,000/pt).

Entry: Buy Stop 2.705 Limit 2.715
Target: 50% Fib=200sma=S/R=2.850
Stop: 2.580 just below recent swing low

Risk: 2.715 - 2.580 = .135 * $2500/pt = $337.50
Reward: 2.850 - 2.715 = .135 * $2500/pt = $337.50
R:R = 1:1 a statistical oddity. Not great but acceptable.


Corn Cup Forming


March corn futures looks like its completed its pull back. However, we still have a way to go before we break out to new highs. So, we've entered (at 427 1/2) earlier than what is prudent. It wouldn't be unusual, in my experience, to roll over and go down further to the 38.2%, 50% or 61.8% Fib. On the other hand, we've reduced the loss if we hit the Stop Loss from our early entry.

We're placing the Stop Loss just under the swing low at 412. The target is at the 27.2% Fib extension on the green range at 468 1/2. We faded the actual 27.2% extension by a 1/4 point to allow for Bid/Ask spread and/or slippage.

On my IB chart, we are at all time new highs for this contract. That's bullish in that there are no resistance levels from previous price action.

Another concern for this trade, besides entering before a break out of the previous swing high, is that we'll need to breach the possible resistance from the uptrend line.

Here are the bullish indications I see that encouraged me to enter this trade:

  • Slow Round Curve
  • Bounce off the 34ema
  • Bounce off previous Support/Resistance
  • Closed above 8ema
  • Above all Moving Averages
  • Retraced to just 23.6% Fib
  • Stochastics are mid-range, providing ample runway
  • General Uptrend
  • Possible Bollinger Bands/Keltner Channel Squeeze Breakout

Decided to use the YC mini-contract rather than the full size ZC contract because we're entering early. The trade parameters are:

Entry: 427 1/2
Stop: 412
Target: 468 1/2

Risk: 427 1/2 - 412 = 15.5 * $10/pt = $155
Reward: 468 1/2 - 427 1/2 = 41 * $10/pt = $410
R:R = 2.65 which is good.

Thursday, December 10, 2020

Corn Looks Wilted - Exit


The top chart is the March Corn Futures 15 minute chart. The bottom chart is the Daily.

Today price rose until it hit our Stop at 427. The high today was 427 1/2. But of course no one out there is hunting Stops. It's just a coincidence. Yeah, right!

Then the "Crop Production" and "World Agricultural Supply and Demand Estimates" reports came out at 12:00pm ET. Notice the big drop. 

This had an important effect on the Daily chart. See how we closed well under the 8ema. So we should get back in right? Everything else being equal, I'd say if we get price follow through to the downside tomorrow then yes. However, things aren't equal.

On the Daily, notice how the candles are alternating green, red, green, red, etc. Its green's turn. Maybe that happens or maybe we get 2 greenies in a row, but its a consideration. Also, we appear to be in a bobble between the 8ema and the 34ema. I'd want to wait for a breakout from that consolidation. Then you have the 50sma coming up to provide additional support. Another thing to consider. Not to mention the weekend starts after tomorrow, and then there's the full moon and total solar eclipse on Monday. If you saw the correlations between these celestial events and the grains markets you'd stop laughing. It sounds crazy to the uneducated but the data shows its no joke.

Stochastics are mid-range. It really looks like we're in a sideways consolidation. Not a good condition for a directional trade. You might play bounces off the top and bottom of the channel back to the center (mean). But that's more of a day trade.

So, bottom line is to wait for a better setup.

The net on this sad little trade is:

Enter: 420 7/8 12/4/20
Exit: 427 1/8 12/10/20
420 7/8 - 427 1/8 = -6.25 * $10/pt (YC contract) = -$62.50

Its a loss but its a small loss. That's the game right? Keep your losses small and let your winners run.

Jan Nat Gas Rising - Post Exit Update 2


The top chart is a 15 minute chart just before the close. The bottom chart is the Daily just about the same time.

As you can see on the 15 minute chart, it was a good thing we weren't long when the 10:30am ET weekly Storage Report came out...not! Without inside information, like in "Trading Places", you should be very cautious about scheduled reports. Its always a crap shoot. But this one did favor the direction I suspected on a technical basis. That's why we entered this trade initially. Can't be too upset about missing a win when you don't really have an edge.

Then the question becomes whether to re-enter the long trade or not. The 15 minute looks a little tired and the Daily isn't closing over the 8ema. So, at this point it doesn't look like time to go long yet. Going to continue monitoring.

Today and tomorrow are the quarterly roll over days. This is a good time to transition over to the March contract while we're not in a trade.

Jan Nat Gas Rising - Post Exit Update 1


We started a leg back up in the middle of the night (NYC time). On one hand I feel sorry I missed getting in on the bounce when I suspected it was coming, but on the other hand, I don't want to be in the market at 10:30am ET when the Nat Gas Storage report comes out. Besides, Stochastics are overbought on the 15 minute when I woke up and saw the rise.

So, think I'll just monitor for now.

Wednesday, December 9, 2020

Jan Nat Gas Rising - Exit


At the peak this morning 12/9/20, on the 15 minute chart above, you can see the high candle and the candle after form a Bearish Harami pattern. Then 3 & 4 candles after form a Bearish engulfing with a close below the 8ema. Then the next candle confirmed it by beginning to continue downward. Plus we had completed an AB/CD pattern overnight (see the thick white angled lines).

That combined with the fact I had a 5 hour live workshop with Larry Pesavento today that already started 9:00am, suggested to me we should capture our profits and sit out the rest of the day in Natural Gas. The point being we had profits, peaked and started downward, and it would be difficult to manage this trade while at the workshop.

So, we exited at 9:37am ET at 2.49. As you can also see, we ended the day further down. Although we did come down to the 61.8% Fib of the yellow range, which is a likely place to bounce. Perhaps we'll get back in tonight or tomorrow.

Meanwhile, we had a winner:

Entry: 2.450
Exit: 2.490
Net: 2.49 - 2.45 = .04 * $2500 = +$100

Tuesday, December 8, 2020

Jan Nat Gas Rising


Top 2 charts are Daily. Bottom chart is hourly.

I see:

  • 3 drives to a bottom
  • Hitting support from previous swing low
  • Very low Stochastics
It's not really a very strong setup, so this is higher risk than usual, and we're in way early relative to my rules. But the Risk:Reward is fantastic.

Entry: 2.450
Stop: 2.350
Target: 2.935 (50% Retracement)

Risk: 2.35 - 2.45 = .10 * $2500/pt = $250.00
Reward: 2.935-2.450 = .485 * $2500/pt = $1212.50
R:R = 1:4.85

Slick Looking Gartley in Jan Soybean Oil - Exit


Well, guess I slipped on the oil slick and landed on my &^%$#@!. Price came down and triggered the new Stop at 37.28, then bounced. Guess what the low of the day was? How about 37.28!

This is the 2nd time I was disappointed by a Gartley pattern. So I did some more research and decided to play the Gartley Pattern differently in the future. Next time we go for Fib retracements of the AD range, like 50% or 61.8%. Then capture our profits and wait to see if a re-entry is warranted.

We would have realized several hundred dollars if we got out at the 61.8% or 78.6% retrace of the AD range.

Here's a nice graphic of the Gartley Pattern. Notice how it implies a target well above the A point. I understand that happens sometimes, but after the first 2 trades I'm setting much lower targets, and maybe get back in.


OK, another lesson learned. I've only actually used the Gartley once before, and it was recently. See https://jmstweets.blogspot.com/2020/11/live-cattle-looks-bullish.html and the updates.

The good news is, assuming price continues down to the original Stop, we did save $468 by raising our Stop. See https://jmstweets.blogspot.com/2020/12/slick-looking-gartley-in-jan-soybean.html

Bottom line:

Entry 37.70
Exit 37.28
Net 37.28 - 37.70 = -.42 * $600/pt = -$252. Put it in the loss column.


Slick Looking Gartley in Jan Soybean Oil - Update 1


Top chart is the 10 min at 7:20am ET this morning. The next chart is the same time on the Daily. We've come down to a low of 37.30, and the 61.8% retracement of our up leg is 37.35. We're below the Daily 8ema. All the other grains have been heading down and continue to look bearish.

I'm concerned we may have seen the high in the reaction to the AB/CD at 38.60. We just closed above the 10min 8ema, so we may be ok. But I'm moving the Stop up to just below the current low on the 10 minute chart, which is 37.28.

If the Stop is hit and things turn bullish again, we can always get back in. But moving the Stop will save us 37.28 - 36.50 = .78 * $600/pt = $468.

Sunday, December 6, 2020

A Hidden Danger of Hedging - Exit


OK, my Stop was hit 19:20 ET at 1.21275 and now I'm out of both sides of this trade and this self-imposed purgatory.

This strategy saved me 1.2132 (18:00 ET open) - 1.21275 (Exit from Trailing Stop) = 4.5 * $12.50/pt * 2 contracts = $112.50 as compared with exiting both sides at the open. Was hoping it would be a lot more.

This expensive lesson cost me $2470, if you net out all the 26 related gains and losses during the trade. 

I consulted author, speaker, trading legend, and all around nice guy Larry Pesavento about my experience here. His advise was "Never hedge a losing position". Amen brother!

A Hidden Danger of Hedging - Update 3


When the candle after the Doji closed, the 2nd closed candle of the evening, I started trailing a Stop just above the high of the candle before the current candle. 

This is a manual process, so again I am a prisoner of my trade, staring at the screen. But at least I'm out of the hedge, and have a clear exit from the original trade. And I have 14 minutes to take a break before the close of each candle.

Notice how the Doji Rule has been working so far. It won't last forever, but Stochastics have a long way to fall, so maybe we'll recover a good portion of the remaining loss before exiting.


A Hidden Danger of Hedging - Update 2


I learned the Rule of the Doji from Steve Bigalow, a candlestick guru. The Rule of the Doji is that price action will continue in the direction of how the candle after the Doji moves. You can see our second 15 minute candle broke to the downside.

So, I implemented my strategy:

"Thinking if we open heading down, take off the long hedge and just trade the original short position from there, using a Stop of course. And never hedge again."

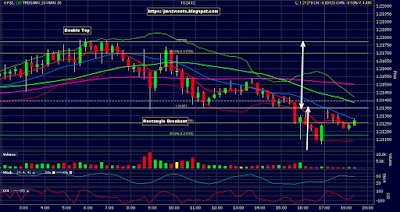
So I exited the long hedge and added a Stop Loss to the original short trade just above the high of the Doji at 1.2136.

A Hidden Danger of Hedging - Update 1


OK, it's Sunday night at the open. I came up with this strategy:

Looking at the Dec EUR 15 minute, I see a double top and a rectangle break out to the downside, with a measured move down to about 1.2095.

Thinking if we open heading down, take off the long hedge and just trade the original short position from there, using a Stop of course. And never hedge again.

If we open up and continue up, I'm thinking see how it handles the support/resistance at the bottom of the rectangle at about 1.2135. Take off one side of the spread accordingly and trade normally from there. And never hedge again.

Now I'm watching this doji form and waiting to see how the chart breaks, up or down, then implement my strategy.

Corn Looks Wilted - Update 3


Noticed we broke down through a long term supportive Trend Line on Friday 12/4/20. See the thin white angled line from bottom left in Aug at about 325 up to the upper right at present day on the Mar Corn futures. See how we broke through the Trend Line and closed below it. This supports our bearish thesis.

Also Fri and Thu candles formed a Bearish Engulfing pattern. And we haven't closed below the 8ema in 5 trading days. This further supports our bearish thesis.

A Hidden Danger of Hedging

Let me save you from making this seemingly innocent but insidious mistake.


12/1/2020


12/2/20


12/3/20


12/4/20


I need to make a confession so my readers, and the future me, can remember this important lesson I had to learn the hard way.

I had a horrible time with a hedge on the Euro this past week because I started extracting profits from the hedge. The positive value accumulating in the hedge is a Siren's song to be ignored. It is a beautiful shiny Pandora's Box that will suck the lifeblood out of you if you open it. I'll explain.

I made a terrible mistake, but I didn't know it. I don't do a lot of hedging but when I got caught short on the Dec. EUR/USD as it took off on 12/1/20, I added a 1:1 hedge using the Dec. M6E micro futures. I didn't exit the trade because I had indications that this contract was going down and wasn't aware news had just come out that would reverse the bearish trend.

By the time my indicators said the short had failed, and I made the decision to hedge rather than exit, my position was already $500 against me. I went long 20 M6E mini's ($1.25/pt) to exactly counter the 2 EUR ($12.50/pt) contracts. This locked in my loss at $500 no matter how high the Euro went. Assuming of course I didn't mess with it. The idea was to let the Euro take this temporary ride up due to some unknown and spurious stimulus, like an institution needing some Euro's. Then when price started falling back to the mean, I would take off my hedge at the level I put it on, and when price came back down to where I entered the original trade, I would be whole again. I didn't have my news feed on at the time, so I didn't know the cause of the rise.

As the value of the hedge grew bigger and bigger I wanted to extract it more and more until I did, again and again. I didn't know what a huge mistake that was. It caused the "protected range"1 to grow bigger and bigger, causing me to imprison myself at the pc to take off the hedge on any reversal, and then replace it at a lower price level. The bigger the protected range grew, the more important it was I catch the next down leg. And that market is open 23 hours. I was trapped like a home bound prisoner with an ankle bracelet. I literally didn't shave or shower or leave the house for 3 days because I had only an hour a day from 17:00-18:00 ET to cook, or any other time consuming activity that would take me away from the pc. I couldn't wait for the FX futures market to close for the weekend. 

Also, it is difficult to trade anything else because you must be ready to manage the hedge at any moment. 

1By "protected range" I mean the locked in loss that the 1:1 hedge provides you. Originally it was $500. It soon grew to $2,500. Your loss is locked in because for every point your original core position loses, the hedge will gain one point. So your protected range depends on the value of your paper loss when you add the hedge. But if you exit the hedge to cash out the accumulated value, with the expectation you'll add the hedge back in at a lower price, but actually add the hedge back in at a higher price because the original price drop was a false signal, then you caused a loss, which diminishes the extracted value and therefore widens the protective range. Another cause for a failed attempt to extract value from the hedge is if you exit the hedge when it has a negative value because you think it has much further to fall, but it doesn't.

I would have been fine extracting the hedge profits, since its just in my trading account as cash instead of in the hedge, but the slippage and failed attempts in the entries and exits cause losses that expand the protected range. 

When many of the long awaited down legs appeared, for which I sacrificed many things, I missed them. Some were due to being asleep, even though the amount of sleep I allowed myself was quite limited. Some were because I had to temporarily focus on something very important and urgent. And the most maddening was just before a news event or a market close when I most needed a hedge. So even though I saw the price dropping and desperately wanted to take the hedge off, I couldn't because in a few minutes there could possibly be a dramatic reversal from the scheduled news event or over the 1 hour daily market closing, or over the weekend.

I'll survive the loss but I'm still stuck in this hedging hell at the moment. Mercifully I'm in the Dec. contract that will expire next week. If I'm still in this position then I'll be forced to liquidate and take the loss, whatever it is. I'll be so relieved, that the pain of loss will be significantly muted.

I've been studying the subject of trading for about 10 years and have never, ever heard or read about this phenomenon. Material on hedging, sure, but the necessity of fighting the psychological pressure of extracting value from the inflated hedge, never. You don't know what you don't know. Now you know.

Bottom line, once you put on a hedge, don't take the hedge off until the core position comes back within the protected range!

Friday, December 4, 2020

Slick Looking Gartley in Jan Soybean Oil


Found a beautiful Gartley Pattern (aka XABCD) on January Soybean Oil. These patterns are supposed to work about 70-80% of the time. I found other bullish indications as well. Here they are:

  • Bullish Gartley
  • Morning Star
  • Close above 8ema and all MA's
  • Bounce off 38.2% Fib on the green range
  • Bounce off previous Resistance 12/29/2020 at 36.28


Target: There are 3 likely sources of resistance that all converge very near each other at 40.50:

  • 27.2% Fib extension on the green range
  • 161.8% Fib extension on the yellow range
  • 161.8% Fib extension on the Gartley AD leg

Stop:Just under the D point of the Gartley at 36.50 .

I entered this yesterday but had no time to blog about it. Today was a beautiful follow through. See the chart at the top. Here's the summary:

Entry: 37.70
Target: 40.50
Stop: 36.50

Risk: 37.70-36.50=1.2*$600/point=$720
Reward: 40.50-37.70=2.8*$600/pt=$1680
R:R 1680/720=1:2.3 which is good

Corn Looks Wilted - Update 2


I've been stuck in a 23 hour a day trading hell since 12/1/20 that I unwittingly got myself into on the Euro (EUR/USD). In fact, I'm still in trading purgatory. I'll make a separate post on it soon, but I couldn't even take the time to post on this trade. 

I did manage to send a couple Tweets from @JMSTweets:


12/2/20

Mar $CORN #Corn $ZC_F #ZC_F $FUTURES #Futures moved our Stop to the original entry.

12/3/20

The Mar $CORN #Corn $ZC_F #ZC_F $FUTURES #Futures Stop just hit 426.90 and closed the position. Entered new order: Stop Sell 421, Limit 386, Stop 427. Sorry I'm behind on my blog. Currently have a big distraction. I'll just Tweet until I can get back to the blog at jmstweets.blogspot.com/


Today, 12/4/20 9:39am ET the new order triggered. New entry is 420 7/8. See the chart at the top.

Current trade:

Entry: 420 7/8
Target: 386
Stop: 427


Tuesday, December 1, 2020

Corn Looks Wilted - Update 1


March Corn went nicely in our favor, confirming the bearish candle pattern.

Added a contract to the short position. Shorted from 421.

Still a very long way to go to the target.

Monday, November 30, 2020

Corn Looks Wilted


Shorted March Corn near the close from 426 1/2 on the Daily chart. Here's what I saw:
  • Bearish engulfing candle
  • Close below 8ema
  • 3 drives to a top
  • Stochastics Overbought
  • Negative Stochastics Divergence (NSD)
  • High volume
  • Corn, Soybeans, Soy Oil, Soy Meal, and Wheat all have short signals today.
  • Full Moon
Considering today starts a Full Moon may seem like a joke to the uneducated trader. You'd be surprised how much work has been done on this subject. Its been shown there is a strong, but not perfect, correlation between full/new moons and the grain markets. There are correlations with other markets too. It works best at market extremes, not as well if the market is moving sideways.

I try to keep an open mind. If something works in the markets I want to use it. I don't care how crazy it seems. I'm not trading to be popular, I'm trading to make money. Ignore proven natural cycles at your peril.

The NSD can be seen if you notice the short white angled line segments spanning the last 5 trading days. One is over the candle tops and one is in the Stochastics panel on the bottom of the chart.

Since we haven't seen confirmation of a down move yet, I'm using the YC mini contract, which is $10/pt rather than $50/pt for the full ZC contract. If things develop properly I'll scale in with more contracts. 

Target 50% Fib 385 1/2
Stop 440

Risk: 426 1/2 - 440 = -13 1/2 * $10/pt = -$135.
Reward: 426 1/2 - 385 1/2 = 41 * $10/pt = $410.
R:R = 3:1 which is ideal.

The 440 Stop is just over today's high, which is also the high since the upswing started at 331 1/2 mid-August. If price gets up there something is wrong with this trade.

You might notice comments on the chart about retracements being less than 38.2%. I was looking for another Fib range to find some confluences but Larry Pesavento teaches that if a pullback doesn't reach 38.2% then don't consider it as a Fib range. So, using that rule, this has been one big upswing from a Fib perspective. That being the case, if we started a downtrend today, then we can expect a retracement of at least 38.2%, 50%, or 61.8%. I have found that 50% is most common in general trading.

Live Cattle Looks Bullish - Exit


Today ended with a doji but the open and the close were both under the 8ema. That's a little bearish. The doji candle represents indecision. The next decisive candle will resolve whether we continue down or up.

The previous 3 candles form an Evening Star pattern. That's bearish.

Looks like we made a new lower swing high. That's bearish.

We never cleared the previous swing high at 115.45. So really, we should have waited to close above that before entering. I was somewhat aggressive here and broke that rule. So I can't really complain if we make new lows before making new highs, if ever.

So, given that we got in too early and these other bearish indications, the best decision seemed like exiting here to limit our losses. We can get back in after we see how the doji is resolved.

Summary:

Entry 113.025
Exit 112.80
Loss .225 * $400/pt = -$90

A very reasonable loss considering this futures contract covers a lot of ground. For example, just 3 trading days ago we hit a high of 114.70. 114.70 - 113.025 = 1.675 * $400/pt = $670.

Here's another thing. If our hedge order was filled (see "Live Cattle Looks Bullish - Update 1") we'd be ahead. Our limit order was for $500 premium. Today's last trade for the 118 Call option was .825 * $400/pt = $330. If we covered our short position there, we would have made $500 - 330 = $170 on the hedge. Then we would have netted 170 - 90 = $80 instead of losing $90.

Paraphrasing Adele, sometimes it lasts in trading, but sometimes it hurts instead.

Friday, November 27, 2020

Live Cattle Looks Bullish - Update 3


From yesterday's post "One might worry this is the left half of an Evening Star presaging a down turn reversal.". Well guess what? It was. This could be a very bad indication for this trade. I was very tempted to close out the trade at break even. 

Why didn't I? I'm afraid I'll be asking that question when I'm down big time. But I stayed in the trade because:

  • We didn't close below the 8ema.
  • Stochastics aren't overbought.
  • The initial conditions for this trade were strongly bullish.
  • I've seen many times where an Evening Star would close very near the 8ema then reverse back up.
  • Today is the Friday after Thanksgiving and the "real" participants were probably not trading.
I re-entered the hedge trade, but since we went almost straight down, the Limit order never filled. 

So we closed the day, with no hedge, almost precisely where we entered the original trade and watched what was once a 114.70 - 113.025 = 1.675 * $400/pt = $670 gain at the high 2 days ago disappear. Not fun.

Now we have to wait out the weekend and see if we get a reversal or a continuation. LE doesn't have overnight hours, so we have to wait for the 9:30am ET open. I look forward to a fantasy future when we have 24/7 markets for everything.


Wednesday, November 25, 2020

Live Cattle Looks Bullish - Update 2


Today opened with a gap up, which is bullish, then filled the gap in, touched the 3ema, and closed very near the open, thereby forming a Doji. The Doji is a neutral indication but closing near the top of today's range and above all the MA's is a bullish indication.

One might worry this is the left half of an Evening Star presaging a down turn reversal. This could happen, especially after a long 4 day weekend with 3 days closed and 1 partial day. But, notice Stochastics are still not overbought. We definitely want to stay in the trade.

We put in a Day order again today for the hedge I explained in the last post. However, price didn't rise enough to trigger the order. So we enter the 4 day holiday period without a hedge. Not as comfortable as I would have been if we had sold the Call option.

However, let me share the following scalp trade I made today:


This is a 10 minute chart of Jan Natural Gas today. Compare this chart with the Feb Live Cattle Daily chart above. Notice something interesting? It's the same pattern. I didn't check all the compliance rules but the NG 10 minute pattern looks a lot like a Gartley Pattern, and the LE Daily is a confirmed Gartley Pattern.

There's a relatively long uptrend followed by a 61.8% Fib retrace in the form of an AB/CD pattern. Then a resumption of the uptrend. You can see this same exact behavior on both charts.

This is a good illustration of the fractal nature of the markets. But that's not why I posted it. The NG chart hit not only the 27.2 Fib extension but also the 61.8% Fib extension as well. In our LE Daily chart we're setting the target for just the 27.2% Fib extension. The ideal execution of the NG 10 minute scalp trade gives me encouragement that our LE swing trade will also hit its target.