Friday, October 30, 2020

Shorted Dec Corn - Exit


Sent a Tweet 6:22am ET saying we moved our Stop to break even and would exit by the end of the day, which we did. Sent Tweet 2:12pm announcing the exit.

Given that we had some profit and this is the Friday before a very high profile Election Day in the USA next Tuesday, it seemed prudent to take off the risk exposure. 

Summary:

Entry 401 (10/28/20)
Exit 398 1/4 (10/30/20)
Profit 401 - 398 1/4 = 2.75 * $10/pt = $27.50
Log it as a win.

Dec Wheat Looks Weak - Exit


Sent a Tweet 6:22am ET saying we moved our Stop to break even and would exit by the end of the day, which we did. Sent Tweet 2:12pm announcing the exit.

Given that we had some profit and this is the Friday before a very high profile Election Day in the USA next Tuesday, it seemed prudent to take off the risk exposure. 

Summary:

Entry 610 5/8 (10/27/20)
Exit 598 (10/30/20)
Profit 610 5/8 - 598 = 12.625 * $10/pt = $126.25
Log it as a win.

Thursday, October 29, 2020

Dec Wheat Looks Weak - Update 2


The set of possible trading errors is seemingly infinite. Yesterday's post said I entered a conditional order to short another contract if price drops below 600 3/4, which I did. Subsequently, price dropped to a low of 598 1/2 but our order didn't fire off.

After some investigation I figured out why. I entered a Market order with a condition. It turns out on the Interactive Brokers Trader's Workstation, Market orders cannot work after hours. If you want your order to work after hours you must use a Sell Stop order. Lesson learned. 

A trader must master at least 4 different domains:
  • Trading Platform
  • Technical Analysis
  • Money Management
  • Psychology
Make a mistake in any one of them and you can lose real money. And retail traders normally trade alone. So no one can say, "hey man, you know Market orders won't trigger after hours right?". And all those possible errors are in addition to the expected percentage of orders that will fail even if you do everything right.

I love trading but wouldn't recommend this to anyone.

Wednesday, October 28, 2020

TLT 6 Bullish Indications - Exit


The bullish setup is still intact but price reversed in the face of resistance from:

  • Down angled trend line, which is top of a channel.
  • Hit equal up leg move as previous up leg, see thick yellow line segments.
  • Hit 200sma.
  • Hit 20sma (yesterday).
  • Hit previous swing low at 160.64 (yesterday).
We are experiencing strong volatility today due to European Covid news and the US election in a few days. I would have exited by Friday's close anyway due to the election.

We could have more upside but exiting seems to be the most prudent decision. Sold the Dec 160 Call option for $4.45 near the close. Sent Tweet regarding this exit 3:46pm ET.

Summary:

Entry 3.00 10/23/20
Exit 4.45 10/28/20
445-300=$145. Add to the Winning column.


Shorted Dec Corn


Daily


Weekly


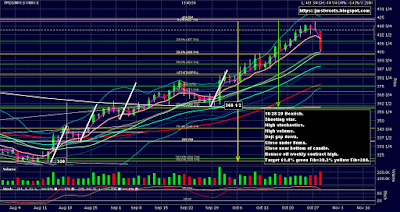
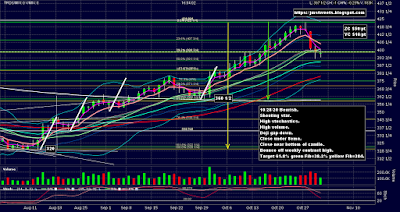
Dec Corn setup a short trade. Entered using the YC contract, to control risk, at the close at 401. Here's what I saw on today's Daily chart:

  • Shooting star candle pattern.
  • High stochastics.
  • High volume.
  • Doji gap down candle pattern.
  • Close under 8ema.
  • Close near bottom of candle.
  • Bounce off weekly contract high (see Weekly chart above). 
Target is 61.8% Fibonacci retracement of the green range, which coincides with the 38.2% Fib retracement of the yellow range, which is 384. Actual target is set to 384 1/4 to account for Bid/Ask spread and slippage.

Stop is 415 1/2 which is just over today's high.

Risk: 401 - 415 1/2 = -14 1/2 * $10/pt = -$145.00
Reward: 401 - 384 1/4 = 16 3/4 * $10/pt = $167.50
R:R 167.50/145 = 1:1.16 not very good but acceptable given a high probability setup.

Dec Wheat Looks Weak - Update 1


Today's price action was constructive. I added a conditional order after the close where if price drops below 600 3/4 (today's low) then short another YW contract with target 588 1/2 (1st contract target is 588 1/4) and stop 615 (just over today's high).

Tuesday, October 27, 2020

Dec Wheat Looks Weak


The rightmost daily candle (for 10/28/2020) just opened about 15 minutes ago at 20:00 ET on 10/27/2020. This gives us a continuation downward after a close beneath the 8ema. See the comments on the chart for the setup, target, stop, and Risk:Reward.

The entry was a conditional order that if price hits 612 1/2 then sell a futures contract. Except we experienced a little slippage and the actual entry was 610 5/8.

Using the YW contract instead of the ZW contract to control risk since we didn't get a bearish candle pattern at the top of the recent swing high.


TLT 6 Bullish Indications - Update 1


The decision whether to stay in the trade or take partial profits should have been easy, but it was excruciating. The last trade for our TLT Dec 160 Call was 4.11, and we originally paid 3.00 for it. That's a 1.11/3.00 = 37% gain. 

TLT price action has 2 gaps on the way up that want to be filled in.

And TLT price is up against resistance from:

  • 20sma
  • 200sma
  • Previous swing low at 160.64 on 8/28/20.
  • ADX DI's were touching right before the close.
  • We're close to the length of the previous up move, see the thick upward angled yellow line segments.
The often referenced voice in my head was screaming at me to take the 37% gain and deal with the rest of the trade tomorrow. But stochastics are not overbought and this seems like a fairly strong setup. We could gap up over all this resistance tomorrow. However, I do think the most likely move from here is to take a down leg to respect this resistance and fill in those 2 gaps, then reverse back up in the original direction of our trade.

This was a brutal mental tug of war. But many times I've traded these types of intermediate pull backs and most of the time it turns out I would have done better to just leave the trade alone unless it gives a sell signal.

So, after weighing things out, I decided to stay in the trade, which required much discipline and hand wringing. We'll have to wait and see how it turns out.

Sunday, October 25, 2020

Mortgage delinquencies worse now than peak of 2009 housing bust

This video (https://youtu.be/8QtsEG51kLg), published 10/16/2020 with Danielle DiMartino Booth states FHA mortgage delinquencies are at 17.5%. 

At the height of the housing bust around 2009 FHA mortgage delinquencies were at 14.4%. Only the CARES Act with its forbearance provisions has kept bankruptcies and foreclosures from skyrocketing.

Most of the provisions providing debt forbearance in housing, cars, and credit cards expires 12/31/2020. 

Watch for market disruptions early 2021.

TLT 6 Bullish Indications


Friday 10/23/2020 Larry Pesavento showed a Fibonacci based bullish Gartley pattern during his internet show on TFNN of TLT, which is the iShares 20+ Year Treasury Bond ETF. He's a famous, successful trader so I took a look at it and found a total of 6 independent bullish indicators:

  • Bullish Gartley.
  • Candlestick Piercing Pattern.
  • Low stochastics.
  • AB/CD.
  • Filled Gap ()158.30-156.85).
  • Yellow -27.2% (157.49), Green 78.6% (157.24) Fib confluence.
Set the target to 50% Fib retracement of the 172.25 - 156.75 range = 164.50, which coincides with a heavy congestion area lasting most of Sep.

It looks very promising as a high probability trade. I'm going to try and scale in if it moves in my favor. Meanwhile, on Friday 10/23/20 I started with a Dec 160 Call Option for $3.00. Remember options control 100 shares, so the cost was $300.

6 very interesting facts I just saw in a video

 Here are some interesting facts referenced in the 8 minute 39 second video published 10/9/20 (https://youtu.be/5Q7UsVJ7wyY):

I didn't fact check any of these but I don't doubt any of them:

  • Since 9/19/20 the Federal Reserve has provided over $9 trillion to primary dealers.
  • 2020 YTD alone we have printed about 22% of all US Dollars issued since its inception.
  • Since the US Dollar's inception in 1913 the cumulative rate of inflation has reached 2,625% which means what cost $1 in 1913 now costs about $26.
  • 100 yrs is about the average lifespan of a global reserve currency.
  • The US Dollar is about 100 yrs old.
  • In 2020 1 in 7 small businesses have closed their doors permanently.

Does this suggest we'll continue with the current global financial system with the US Dollar as the main reserve currency, or does it add merit to the anticipation of a sea change? Maybe not from the insolvent USA? Maybe digital sovereign currency replacing paper money, that the central banks can monitor and instantaneously adjust at will? Maybe back the next reserve currency with something real, such as a precious metal(s), to instill confidence in the new currency?

Just saying.

Sunday, October 18, 2020

Soybean Oil Dec Short - Exit Update 1


I was looking back at this painful trade and realized where I went wrong. I somehow forgot to look left.

If you look at where this short trade reversed on Oct 5th, then look to the far left of the chart, you'll notice price bounced off a previous congestion (aka consolidation) area. I missed this when originally analyzing the chart. I could blame it on a number of distractions but it doesn't matter. Its up to me and if I miss something I will have to pay for it. Of course, I could miss nothing and still have a losing trade due to market forces such as news or a big trader deciding to get in or out or manipulate the market to execute a strategy. You have to expect losing trades when trading. Anything can happen. So making mistakes makes trading even more precarious.

The biggest lesson here is ALWAYS LOOK LEFT! A lesson I already learned but unintentionally didn't heed.

Friday, October 16, 2020

LE Live Cattle Dec Futures Short - Exit


Short and sweet trade! Hit our 1st target today at 108.75. No heat to deal with, no "shall I stay or shall I go" decisions. Just came right down and hit it. Nothing really more to say. 

I kind of needed a trade like this after that Soybean Oil trade. Anyway, here's the net:

Entry: 10/14/20 110.20
Exit: 10/16/20 108.775
110.20 - 108.775 = 1.425 * $400/pt = $570
Put it in the Win column.

Notice how the candle ended right on the 200sma today, which is also the 78.6% Fib retracement of the yellow range. Anything can happen from here, but from where we closed and noticing stochastics are oversold, I'd expect a bounce back up to at least the 8ema, or the 20sma, or a 50% or 61.8% Fib retracement of the current leg down from 113.30. If we get that, then we'll take a look at re-shorting this trade for the 2nd target.


Wednesday, October 14, 2020

LE Live Cattle Dec Futures Short


Live Cattle Dec Futures daily chart looking Bearish. Here's what I see:

Lower highs, lower lows last 2 swing cycles.
Negative Stochastics Diversion.
Trend Line Break Out.
2 Bearish Harami candle pattern's.
Bearish Left/Right Combo candle pattern.
Close below 8ema with continuation.
Doji sandwich candle pattern.
Close below 50sma.
Possible Bollinger Band/Keltner Channel Break Out.
Stochastics are mid-range; more room to run to the downside.
Last 3 candles are relatively high volume.

Short from 110.20 13:57 ET.
1st Target 200sma=78.6% yellow range Fib=108.75
2nd Target 161.8% yellow range Fib=161.8% green range Fib=103.35
Stop 111.60; above high of 2nd candle back. Probably above 8ema.

Risk: 110.20-111.60=-1.40*$400/pt=$560
Reward: 110.20-108.75=1.45*$400/pt=$580
R:R 1:1 Not great but this is a high probability setup, plus there is a possibility for a 2nd target.

Friday, October 9, 2020

Soybean Oil Dec Short - Exit


Our 33.50 Stop was hit 2:24am ET. Good thing compared to no Stop or a "Mental Stop" because I was asleep at 2:24am. Not such a good thing when compared to the unmistakable Bear Flag Breakout pattern we had.

The thin white horizontal line at the base of the candle bodies at the swing low is the midpoint of the thick white angled line segment, which is the CD leg of the AB/CD projection. This is another example of the halfway point into a projected move being the extent of the move. Considering the Fibs near the 200sma and the bottom of the AB/CD projection, it seemed far more likely than the midpoint of the CD leg as the swing low. 

We exercised good discipline by not moving the Stop Loss or just exiting the trade but surprisingly the original setup, as aesthetically pleasing as it was, happened to be one of the smaller percentages of the time an AB/CD and Bear Flag Breakout  doesn't work out. Have to just accept it and look for the next trade where we might make our money back, and then some. It seems like the first trade setup you should take, but don't, because you think "I've taken some hard losses lately so I'll just watch this time", is the trade where you miss out on a large win that covers all your losses. If you believe in your methodology then you really need to take every valid setup.

The sad result of this failed trade is:

31.90 Entry - 33.55 Exit = -1.65 * $600/pt = -$990.


Thursday, October 8, 2020

Soybean Oil Dec Short - Update 4


Shockingly we got the same candle today as yesterday. Its almost perfectly the same:

Yesterday:

Open 33.01
High 33.46
Low 32.80
Close 33.03

Today:

Open 33.03
High 33.45
Low 32.81
Close 33.00

It's so close it probably doesn't matter but today's High was 1 tick lower and today's Close was 3 ticks lower. The Low was 1 tick higher, but the Close is the most important. Like I said it probably doesn't increase our odds any, but it's certainly nice to see.

It's good our Stop wasn't hit today but 2 Doji's mean twice the indecision. I'd say it's because of tomorrow's big Grain Report at 12:00pm ET, but all the other grain futures, Corn, Bean Meal, Beans, and Wheat all made rather rangey moves, although no change in trend was demonstrated.

It doesn't make any sense to exit now. I suspect there won't be much price move between tonight and the report. So, being that our Stop is nearby, we might as well stand by and see what the reaction is to the report tomorrow.


Wednesday, October 7, 2020

Soybean Oil Dec Short - Update 3


We had a close shave today! In fact, it couldn't have been much closer. Our Stop Loss is 33.50 and today's high was 33.46. The fact that we came this close and didn't trigger the Stop helps dampen my paranoia about market makers running every Stop Loss they can find.

We may have gotten some help from the 20sma providing resistance. There's also congestion on the left around  8/27-9/9, but its spread over a large enough price range such that we can't pick a precise level. And of course our Bearish Flag from which we recently broke out to the downside could provide some resistance. But to come this close to hitting our Stop is amazing. Of course, we could easily hit it overnight or tomorrow.

Today's price action resulted in a tight Doji on the Daily chart. It closed over the 8ema. I would have preferred a nice big red candle with a close below the 8ema. But I'd much prefer a Doji (representing indecision between the Bulls and Bears) to hitting the Stop. 

At today's high we had an unrealized paper loss of 33.46 - 31.90 = 1.56 * $600/pt = $936. Ouch. The original pattern that seduced me into entering this short position was so beautiful and textbook that I never thought we'd ever get this close to the Stop.

 It surpassed the previous swing high at 33.41 by just 5 ticks then started down. Perhaps just enough to scare out the Bears and bring in the Bulls before reversing against them. You might say that's paranoia talking, but why do you so often see a slight new high followed by a quick reversal? I don't know the answer but it sure looks suspicious.

The top chart is the Daily and the next chart is the 4 hour chart. Notice on the 4 hour chart we closed just under the 8ema. Not by very much but it does provide some encouragement. You can also see Stochastics are very high. Another helpful circumstance for our short position.

Bottom line is I'm very grateful our Stop wasn't hit and we still have a chance to salvage this trade. This Friday 10/9/20 at 12:00pm ET we have a potentially impactful Grains Report coming out. So we need a big red candle tomorrow, Thursday night, and Friday morning to get as far away from our Stop as possible, to make room for a possible "false" bullish reaction to the report before a significant drop.

Tuesday, October 6, 2020

Soybean Oil Dec Short - Update 2


If yesterday's decision to stay in our short position was difficult, today's was severe. The top chart is a daily chart and below it is a 4 hour chart.

The Daily chart shows we went significantly above the 8ema and uncomfortably close to our Stop at 33.50. The worst thing is we closed much closer to the high than than the low. Combined with the previous 2 days' candles, it looks like a Bullish Engulfing pattern followed by a close above the 8ema. That is enough to close out the position.

However, we have not yet made a new swing high, and the bigger picture is we broke out of a Bearish Flag pattern and hardly went down at all. Also, notice we only made it down to the 38.2% Fib retracement of the green range. I've seen many times where a chart will bounce off the 38.2 Fib but then roll over and continue down to the 50% Fib of the same range. And that is where our target is.

Looking at the 4 hour chart, you'll see we're up against the 200sma on high Stochastics. If we roll over from here we'll make a new swing low on the 4 hour chart. That's a bearish indication.

This is a very difficult decision. Technically my rules say to exit and prevent further loss. But in this situation we're so close to the Stop that it won't be much of a financial difference whether we exit here or the Stop. So I decided the incremental loss of remaining in the position vs exiting now is worth waiting to see if the price action reverses when the market re-opens at 20:00 ET tonight, and avoid the loss altogether.

Well, the USA has rules (laws) written by the legislative branch but it was necessary to create the judicial branch to use judgement in applying those rules. So it makes sense there will be cases where it makes sense to bend my trading rules. (Wow, how's that for a rationalization not to suffer a loss lol). 


Monday, October 5, 2020

Soybean Oil Dec Short - Update 1


It looks bad. And it might be bad, but its not time to quit, even though we're down about $500 per contract. Today's price action created a Bullish Engulfing candle but we closed under the 8ema. We use the 8ema as a trend indicator. If we stay under the 8ema then we're still in a bearish trend. Its just a retest of the support we broke through yesterday.

Believe me, my brain is screaming get out before you lose more, but this is when discipline counts. So we left the position on. We can certainly continue up tomorrow, hit our Stop, and lose twice as much money as getting out today, but those aren't the rules and it would be an emotional decision.


Sunday, October 4, 2020

Soybean Oil Dec Short


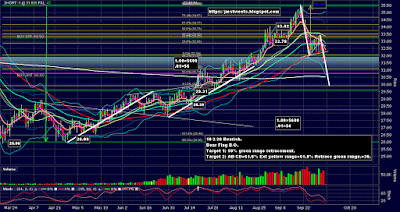
Price formed a Bear Flag and broke out through it to the downside. There are 2 good target areas.

Target 1 is the 50% Retrace of the green range (30.75), which is very near the 200sma (30.50). We're using 30.80 to be conservative.

Target 2 is the 61.8% Fib Extension of the yellow range (29.91) which is at the AB/CD (29.91) which is also near 61.8% Retracement of the green range (29.63). We're using 30.00 to be conservative.

Entry: 10/2/20 31.90.
Target 1: 30.80.
Target 2: 30.00.
Stop: 33.50 just above the bear flag high.

Risk: 31.90 - 33.50 = -1.6 * 600/pt = $-960
Target 1 Reward: 31.90 - 30.80 = 1.1 * $600/pt = $660
Target 2 Reward: 31.90 - 30.00 = 1.9 * $600/pt = $1,140

Saturday, October 3, 2020

Dec Wheat Descending - Exit


9/28/20 and 9/29/20 were inconsequential price moves terminating near but below the 8ema. Then on Wed 9/30/20 my lack of attention to the USDA report schedule was equivalent to stepping on a landmine. The Grain Stocks report at 12:00pm ET (https://usda.library.cornell.edu/concern/publications/xg94hp534) moved Dec Wheat price up like it stepped on a Claymore.

If you've been following this thread you'll know our stop was 578 1/2. The high for the day was 587. Enough said. Other than paying attention to potentially market moving scheduled news is important.

If I realized this report was a potentially high impact one and was about to be released, I could have taken some protective action, such as:

  • Exiting the position.
  • Reducing the position size.
  • Buying a Call option or spread.
  • Sell a Put option spread.
  • Taking an opposite position in a different month.
  • If trading the ZW contracts we could take a long position in the YW contracts.
And there are probably other hedges.

Frankly, I don't know all of the many Ag reports that represent time bombs and which ones aren't significant. But its time I do the research and find out. I'll post a separate entry on this blog on this subject after I've done the research. Certainly the report mentioned above is on the list. Its roughly quarterly but its not a regular period. Best to check the link above and click on "Release Calendar" and check every month for the Grain Stocks report. I know I will. I looked at the calendar for the next one up through Feb 2021 but its not listed. I'd expect it to be in early January 2021 based on the previous 4th quarter.

So, thanks to my oversight. here's the damage:

Shorted 548 1/4 9/23/20
Covered 579 1/8 9/30/20
548 1/4 - 579 1/8 = 30 7/8 * $10/pt = $-308.75 loss

Glad we used the mini-contract. The full size ZW contract would have been much worse:

30 7/8 * $50/pt = $-1,543.75