Friday, February 26, 2021

May Corn Rise - Update 7


This was a tough one. There is a case to hold and a case to bail.

On one hand, we recovered very nicely from a bearish down day and closed very close to the 8ema. We apparently got support from the 20sma and 20ema. We haven't been able to close below the 8ema for 5 days. The greater trend is clearly upward. We have 3 incidents of support from the 20sma between 1/21/21 - 2/22/21, even when we're looking weak. The BB's inside the Keltner Channel suggest we're in a sideways consolidation, not a down leg. Stochastics are still mid-range, so we're not overbought.

On the other hand, we did close a little under the 8ema. The past few days look like a lower swing high, which, if true, is a bearish indication. We have a full moon tomorrow which can signal a change in trend for some asset classes, including Corn (I know that sounds crazy to the uninitiated, but, as I've covered in past posts, the historical data and very smart, experienced, professional traders give it some serious weight in their trading). However, a caveat on the moon influence is that you're in a strong trend. We're going sideways, which means we should discount the influence from a full moon. Also, there's a bearish Gartley-like pattern from the recent swing high at 572. And you can see from the volume today and yesterday there is a battle raging between the Bears and the Bulls, with neither yet winning. 

You can see why its a tough call whether to hold over the weekend or sell today and get back in next week if things are looking Bullish. The thing is, if you sell today for safety, and corn gaps up at the open Sunday night and continues up, we'd miss the gap and have a hard time entering back in without a pull back. So we could miss the whole rest of the trade.

I considered that holding our position has proved to be the right move so far, even when we took a dip on 2/19/21 and closed under the 8ema. Given all that plus considering we're trading the mini sized contract, I decided to hold the position over the weekend.

Thursday, February 25, 2021

May Corn Rise - Update 6


Well, we had a sell off today, just like seemingly every other asset class known to trading, but then we retraced back up to the 8ema and closed right on it. There's a large volume bar today but we closed in the middle of the price bar, and not below the 8ema, so you can't really say the Bears won, even though the candle is red. So bottom line, we don't have a sell signal. Not yet anyway.

Friday's in the corn futures market tend to be inconsequential to the current trading pattern. You can take a look at the past 7 Fridays, and only last Friday 2/19/21 looked like it meant something, but it turned out to be inconsequential, other than maybe scaring some less experienced traders.

I didn't post yesterday on this corn trade because there was nothing to say. The next 2 or 3 trading days should tell us how we're doing. Of course, tomorrow could be a surprise to the downside and we'll have to bail on this trade. We'll see.

Also, soy oil, meal, beans, and wheat all closed such that they are continuing their Bullish mode. Although Soy Meal looked a bit weak. But none of the grains suffered any damage from today's sell off in other futures.

Tuesday, February 23, 2021

May Corn Rise - Update 5


We opened exactly where we closed yesterday at 550 1/2. We made a nice little move up before retracing and closing to form a Shooting Star, except Stochastics are not overbought, so its not a problem.

We closed over the 8ema and still on a Bullish track. Also, notice how we closed with the Bollinger Bands inside the Keltner Channel. We are now officially set up for a BB/KC Squeeze Breakout, which is great news, if we continue on our upward trajectory. But instead, this might be an indication we're going into a sideways consolidation. We'll see. (You can't see the bottom BB inside the KC because its blocked on the screen capture, but I checked and its definitely inside.)

Monday, February 22, 2021

May Corn Rise - Update 4


We got the bounce off the 20sma we were looking for, as described in the previous post. In fact, we gapped up a little at the open and pretty much went up from there. Nice bullish price action.

We closed the day over the 8ema on strong volume. We could just drift sideways for a while from here, but looking to the left (off today's chart) you can see this has been much more of a trending market than a sideways market.

So, we shook off the bearish feel from the previous few trading days, and stayed in the trade.


Friday, February 19, 2021

DBX AB/CD - Exit


See how yesterday's candle was a green candle and today's candle gapped down at the open and closed with a red candle? That's known as a "Bearish Kicker" candlestick pattern and is a very bearish signal. We did bounce off the 50sma and might continue up next week, but closing below the 8ema and the 20sma after a Kicker signal left no choice but to exit this trade.

Summary,

2.47-2.96=-$49. from yesterday's post.

Feb 26th 25 Call .25-1.26=-$101

Net loss -$150.


May Corn Rise - Update 3


Not a Bullish close today. We made a break to the upside, which would have formed a bullish engulfing candle, but made a lower swing high instead and closed under the 8ema. If we close lower next trading day, we'll have to exit this trade.

But notice the yellow comments I added to the chart. See how the previous 2 closes below the 8ema bounced off the 20sma the next trading day? Let's give this a chance to do it again. The thing that's different this time is that the previous 2 times the previous swing high was a new high. This time its a lower swing high. This is a bearish sign.

Bottom line was we stayed in the trade to see if we get a bounce and head back up.

Thursday, February 18, 2021

May Corn Rise - Update 2


"Groundhog Day" all over again (movie reference and a Yogi Berra reference all in one). Meaning today we made another Doji candle about the same size and location. As long as we close over the 8ema I'll be happy. Well, for a while.

I see the possibility we're beginning to set up a sloppy Head & Shoulders Pattern. That would not be my preference. But for tomorrow, being Friday, I'm expecting another small inconsequential candle, which would mean we'd need to hold the position over the weekend. Also not my preference.

DBX AB/CD - Update 8


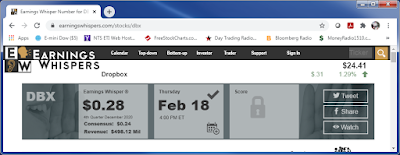
The top image is from earningswhisper.com showing DBX expectation was $.24 EPS with an actual of $.28 EPS. .04/.24=17% beat. $.04 seems mild but it should allow our Bullish setup to continue, unless management says something bearish.

The top chart in the middle is a 1 minute chart showing the reaction to the ER release. The bottom chart is a wider view of the whole setup.

At about 15:45, before the ER release, I decided to sell the Apr 25 Call for $2.47 and buy a Feb 26th 25 Call for $1.26. This cut my risk in half, and if we got a positive report (which we now know we did), then the much higher Gamma will give us more profit if the move is big enough such that the higher Gamma will overcome the higher Theta.

Doing this resulted in a small loss on the April option:

2.47-2.96=-$49.

Keeping the target the same at $29. 

Now that we know the ER turned out well, I may buy a longer dated option when we sell the Feb 26th option, if we haven't hit the target yet and the risk/reward makes sense.


Wednesday, February 17, 2021

DBX AB/CD - Update 7


Well, the Quarterly Earnings Report is due out tomorrow after the market close. Today we closed right on the 8ema. I think today and tomorrow, and maybe yesterday, we're just going to consolidate until the Report. So Technical Analysis probably doesn't even matter.

At this point the big question is whether to hold the position over the Earnings Report. There are 3 possible cases. Earnings exceed expectations, a "beat". Earnings fall short of expectations, a "miss". Or, Earnings are close to expectations.

If we get a beat, and the stock takes off to the upside, then the greater daily pattern will be a J-Hook if you include the previous up leg, or a Cup & Handle if you just look at the recent dip since Christmas.

If we get a miss, and the stock takes a dive, then we have a Double Top formation on the Daily chart. 

If the Report meets expectations, then the previous pattern should continue on, which has been Bullish.

Normally, I don't like holding over ER's because they are a crap shoot. There is a method to calculate a statistical expectation. You look through the history of ER's and simply count the number of each of the 3 possibilities and calculate the percentages. I'm not sure if that actually gives you an edge or not.

However, in this case, we have a very bullish technical setup, which you can argue is an indication the market believes we won't get a miss. Two out of the three possible outcomes are bullish. Also, if you look at the price range the past 4 months have covered, its like 18 - 25, which doesn't look very dangerous. In addition, our position is in long options, which have a fixed maximum loss equal to the cost of the options.

So, given the specific circumstances of this particular trade, I'm leaning towards holding the position over the Earnings Report tomorrow after the market close. I'll decide near the Close tomorrow, after having seen the day's price action.


May Corn Rise - Update 1


Not much to say here. Today formed a little Doji candle, which indicates indecision. We're still above the 8ema and nothing has changed. So, its simple decision to stay in the trade.


Tuesday, February 16, 2021

DBX AB/CD - Update 6


Today doesn't look pretty but the bullish setup is intact. We gapped up at the Open, which is Bullish, then we retested the 8ema and retraced back up by about half, closing (24.49) very close to the previous Close (24.51).

We're beginning to form the J-hook pattern we were planning on, so all in all not a bad day.


May Corn Rise


We're in way early on this one. Really it was the turn around on the Wheat chart that brought me to this trade. Here's that chart from today:


I checked soybeans as well, but it looked like corn had the best, cleanest, strongest set up, so I waited until just before the 14:20 ET close to make sure the pattern didn't change, and went long at 549 1/2. I used the YW mini contract because we're getting in so early. It would be a safer trade if we waited until price closed over the 572 swing high.

The setup is a possible AB/CD pattern with today and the previous trading day forming a Kicker candlestick pattern. The Daily chart has been in a general uptrend for many weeks. And Stochastics took a dip to the mid range which gives us some renewed runway.

I don't see any grain specific reports due out this week at www.usda.gov/media/agency-reports.

Notice the calculated D point of 600 3/4 is just over the 593 27.2% Fibonacci Extension and at a round number of 600. Three good targets would be 593, 600, and 619 3/4 which is the 61.8% Fib Extension. To be conservative, I picked the closest, which is 593. The actual target is a limit order at 592 3/4 to account for Bid/Ask Spread and slippage.

The Stop is at 523, just under the C point.

If we clear the B point and look like we're continuing upward, I'd like to add to the position.

Summary:

Entered: 549 1/2
Target: 593
Stop: 523

Risk: 523-549 1/2 = -26.5 * $10/pt = -$265
Reward: 593 - 549 1/2 = 43.5 * $10/pt = $435
R:R = 435/265 = 1.64:1 Not great but acceptable.


Short May Wheat - Exit


We got a "Dear John Letter" for Valentines Day from May Wheat. Today's candle combined with the previous trading day's candle form a Doji Gap Up pattern. This is a very Bullish pattern. We closed well above the 8ema after filling in the gap. We also broke through the downward Trend Line and closed well above it. That's another Bullish pattern. And we did all this on unusually high volume, which tends to validate the move, in my opinion.

We may just be bouncing around inside a sideways channel between about 631 - 669. But would we want to take that chance? I'd say no.

There was a chance we could have closed under the 8ema today. We did spend some time down there. But that would be a long shot and would have been just a case of hopium. So I closed the trade at 655 3/8. I sent a Tweet at 11:56am ET. Good thing too because today's high was 664 1/4 so it would have hit our Stop at 663 anyway.

The day was going to end so strong, I took a look at going long wheat as well as soybeans and corn. Corn looked like the best chart for a long position, so that's what I did. I'll start a new thread for that trade.

I heard there was a fundamental reason for this reversal having to do with the cold weather in the Texas area, but I don't want to get into fundamentals on this technical trading blog.

It would have been a safer trade if we waited for a close below the swing low B point to confirm the CD down leg of the AB/CD pattern before entering the trade. So this is the reward for taking a higher risk trade.

Summary:

Entry 639 5/8 - Stop 655 3/8 = -15.75 * $10/pt (YW) = -$157.50

P.S. I actually made it back by scalping a long trade today on the full ZW contract, but that doesn't really count as far as the short swing trade goes.

Friday, February 12, 2021

Short May Wheat - Update 2


Retested the 8ema and closed between the 8ema and the 50sma. Today might as well have never been, as far as this trade is concerned.

Quoting yesterday's post "Wouldn't be surprised if we bobble between the 8ema and the 50 sma for a couple few days.". Nothing else to say about this trade. We'll see what happens next week.


DBX AB/CD - Update 5


Looks like patience and tolerance paid off. We're looking much better with a nice sized green candle and a close above the 8ema. Stochs have been brought down to the mid-range, so lots of runway for next week.


Thursday, February 11, 2021

DBX AB/CD - Update 4


Well, I'm pushing out of the comfort zone a bit at the Close today. You can see we're closing a little under the 8ema. Technically, I should exit the position, but I think we're close enough to the 8ema to give it a chance to recover tomorrow and go back up. If we don't, we'll have to exit and watch for an opportunity to get back in.

If you look left you'll see 4 peaks followed by a swoon back down, then a recovery to the upside. We're in the swoon after the 4th peak. Since this peak is at the same level as the first peak, I expect a little extra volatility, which will result in a Cup and Handle pattern. This will probably mean we'll need to exit tomorrow. But the good news is we may be able to re-enter our long position from a lower price, and thereby give us a better Risk/Reward ratio and ultimately an opportunity for greater profits.


March Natural Gas Bearish Gartley - Post Exit Update 1


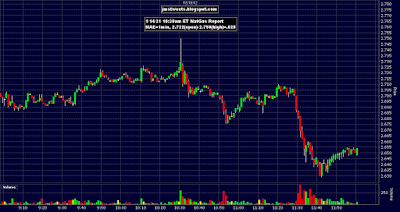
Above is today's 10 minute chart centered around the 10:30am ET "Natural Gas Storage" Report.

I entered a limit order to re-short at a 50% retracement back up. But, as you can see, price never got that high. At this point, with tomorrow being Friday, I decided it would be better to wait until next week to re-enter this trade, looking for a significant downside in accordance with the Gartley Pattern.


Short May Wheat - Update 1


After closing well below the 8ema yesterday, today we went back up and retested it. Then we came back down and closed a little lower than yesterday's close, but above the 50sma.

The 50sma can supply significant support, so it will be important to close below it soon. Wouldn't be surprised if we bobble between the 8ema and the 50 sma for a couple few days.

If we can break through the 50sma, as this trade expects, the next challenge will be the 61.8% Fib, which I expect will be coincident with the bottom Bollinger Band and Keltner Channel by the time we hit it. After that, it looks like clear sailing down to the target.

When we hit the 61.8% Fib, I'm expecting to move our Stop to break even. The 61.8% Fib may be all we get. Meaning we may reject off the 61.8% Fib and climb back up without ever reaching our target.


Wednesday, February 10, 2021

March Natural Gas Bearish Gartley - Exit


At 9:01am ET this morning I Tweeted "Moved Stop to break even on short position ahead of the Crude Oil Inventories at 10:30am ET in case there's a sympathetic reaction.".

At 9:32 I Tweeted the Stop was hit. We exited at 2.860. Profit was:

2.880-2.860=.020*$2500/pt=+$50.

Tomorrow at 10:30am ET we'll get the weekly Natural Gas Storage Report. Leaving a trade on during one of these reports is a craps shoot. That's just gambling without an edge in my opinion. There may be a way to have an edge, but I don't know what it is. I only want to take trades where I have a positive expectancy. So, I don't mind being out. However, we are still in the middle of a Gartley pattern. If we get a negative response to the report tomorrow, or otherwise resume a downward trajectory, I want to re-enter this short trade.

As long as the X point at 3.320 isn't breached, then I'll look for an entry point. I was thinking about having an automatic strategy, like a conditional sell order that's at least a minute after the report and the price is below today's Open or maybe below today's Low. But the reaction to the report might be crazy and last more than 1 minute, so I'll just trade it manually.

While I was considering entering the automatic order, I looked back at some previous Thursday's on the 1 minute chart to see how long the reaction to the report actually lasted. Here's what I found:


These are the 1 minute charts of 1/14/21, 1/21/21, 1/28/21, and 2/4/21. As you can see, the "stop sweeps" adverse reaction, if there is one, doesn't last more than 1 minute on this exceptionally small sample set. Didn't have time for a good study, but still wanted to do a limited search.

So, bottom line for today is we're safely out of harms way with a $50 profit, and looking to re-short NatGas after 10:30am ET tomorrow.


Short May Wheat


Corn, Soybeans, and Wheat all look weak today, but Wheat looks like the best short to me. Shorted the YW mini contract 2 minutes before the 14:20 ET close from 639 5/8. The chart above is the May Wheat Daily chart.

While this trade has some challenges, because we don't have enough confirmation, I decided to risk entering a little early based on the very Bearish setup and limit our financial risk. 

By lack of confirmation I mean we bounced off the 50% Fib on the previous up leg, as well as the 50sma, on the Daily chart, without making a lower low. We also haven't seen continuation downward by a second candle. And we may be in a sideways consolidation or wedge rather than a cascading down trend. The Bollinger Bands are still inside the Keltner Channel and Stochastics are mid-range. Because of all these challenges I decided to use the YW mini contract ($10/pt) rather than the ZW full contract ($50/pt).

By limiting our financial risk by getting in early I mean our risk is the distance from the entry to the Stop, so a higher entry is closer to the Stop than a lower entry. If we wait for confirmation we'll have a lower entry.

Here are the Bearish indications I see:

  • Dark Cloud candlestick pattern
    • 2/8/21 .5*Body=(647.75+659.5)/2=653.625
    • 2/9/21 Close=654; very close to half the body, as calculated above
    • 2/8 Hi=661, 2/9 Open=661; satisfies requirement of 2nd candle >= 1st candle high 
  • Close below 8ema
  • Possible Head & Shoulders
  • Possible AB/CD
  • Cascading lower highs after 52 wk high

Target = 604, just before the calculated D=603 1/4 (notice the 78.6% Fib is 595 3/4)
Stop = 663, just over most recent swing high 662 3/4

Risk = 663 - 639 5/8 = 23.375 * $10/pt = $233.75
Reward = 639 5/8 - 604 = 35.625 * $10/pt = $356.25
R:R = $356.25/$233.75 = 1:1.5 not great but acceptable

DBX AB/CD - Update 3


The best part of today was the open. We gapped up by 24.78(today's open) - 24.15(yesterday close) = 0.63, which is .63/24.15 = 2.6%. That's significant. Which may be why longs could have taken some profits. Of course, I don't know if either is true, but a nice gap up is certainly a Bullish indication.

We closed the day right on the 8ema and not under the 8ema. So, based on that, I don't see a good reason to exit. We'll see what happens tomorrow.


Tuesday, February 9, 2021

March Natural Gas Bearish Gartley - Update 1


Good day in favor of our short position. Today's candle combined with the past 2 days, form a 3 candle pattern called a Doji Sandwich. This is a Bearish pattern and suggests more downside.

Nothing to do but hold the short position. It hasn't been a big enough move to lower our Stop to break even yet.

DBX AB/CD - Update 2


Yesterday I wrote "Because we're at the previous swing high, it's common to find some resistance. So we may take a little dip this week and test the 8ema.". That's exactly what we saw today.

We opened a little higher this morning then dropped downward, but we closed above the 8ema. In fact, we didn't even touch it.

However, while we didn't form an official candle pattern, its similar to an Evening Star, and stochastics are high. Also, the ADX flattened out (see the middle subchart purple line). So we do have reason to be cautious. 

If we continue down and close below the 8ema, this chart will look like a Double Top may be forming. Meanwhile, we need to hold our position.

Monday, February 8, 2021

March Natural Gas Bearish Gartley


We have a Gartley Pattern that satisfies my "relaxed" set of rules. By "relaxed" I mean it may not fit a traditional strict set of rules, such as the following diagram, but I was taught by a well known trader a more relaxed set of rules that still has a success rate of 65% or so. By "success rate" I mean it hits a 61.8% retracement of the AD leg.


Because its quite possible we'll continue higher and surpass the current D point, I want to mitigate our risk by using the QG mini contract, where 1 point is $2500, as opposed to the full size NG contract where 1 point is $10,000.

I went ahead and entered a bearish trade because the current D point satisfies the AB=CD Pattern where it reached the 61.8% Fib of the green range and the nearby 27.2% Fib extension of the yellow range. Like I just said above, price could continue to rise and make a new D point at the 78.6% Fib of the green range near the 61.8% extension of the yellow range. But if we wait for that and we drop from here instead, we'll miss the whole trade.

Entered today at 2.880.
Stop just over the D point at 3.060.
Target .618AD = 3.057 - .618(3.057-2.268) = 2.569 
    (actual target is 2.575 to account for slippage and .005 minimum increment in the QG contract.)

Risk: 3.060 - 2.880 = .180 * $2500 = $450.
Reward: 2.880 - 2.575 = .305 * 2500 = $762.50
R:R = 762.50/450 = 1:1.7 which isn't great but its acceptable.

(P.S. I know the trailing 0 on a decimal is unnecessary since its implied without writing it but it shows precision of the number and it looks nice. It also matches the way price is shown on the y-axis of the chart.)

DBX AB/CD - Update 1


Today we gapped up. rose further, then came back down to fill the opening gap, and closed near yesterday's close. We also broke through the previous swing high at 25.16 but have yet to close over it.

Because we're at the previous swing high, it's common to find some resistance. So we may take a little dip this week and test the 8ema.

Certainly looking bullish enough to hold the long position. All of our bullish indications are still intact.


Friday, February 5, 2021

DBX AB/CD


Dropbox (DBX) has its Quarterly Earnings Report in a couple weeks on 2/18/21 after market. That gives us 8 more daily candles (Equity markets are closed Mon 2/15/21 for President's Day). We only need 4 more candles of today's size to hit the D point of the AB/CD pattern.

I plan to exit before the Earnings Report even though its a Bullish chart. These reports are too much of a crap shoot without some kind of edge other than the current chart. There are strategies for trading Earnings Reports, but I only tested one of them and it didn't work. There is another one I'd like to test but haven't yet.

The top chart is a wider view of the Daily chart to include the AB/CD projections for 1:1, 1:1.272, and 1:1.618. The second chart is a close up of the Daily to see better detail of the recent price action.

I see a number of Bullish indications:

  • J-Hook candle pattern
  • Bounce off the 50sma
  • Couldn't hit the 50% Fib on AB
  • Bollinger Bands/Keltner Channel Breakout
  • Positive Stochastics Divergence
  • Higher highs
  • Above all Moving Averages
  • Possible AB/CD pattern
Got DBX Apr 25 Call at $2.96 when DBX was 24.94. I Tweeted earlier today that I was going long on DBX and posted a chart.

Stop = 21.00 just under C point.

Targets:
1.272AB=27.21
C+AB=D=29.08
1.618AB=29.80

Shooting for the 29.08 target. Using the stock price for risk/reward calculation:

Risk: 24.94-21.00=3.94
Reward: 29.08-24.94=4.14
R:R=1:1.05 no where near 1:2 but it appears to be a high probability trade.