Friday, January 21, 2022

Paypal may be a friend again - Exit


With friends like these who needs enemies? The Jan 220/230 Call option spread expired today. The Butterfly pattern never took flight. No pattern I know of has a 100% win rate, and I've heard the same from experts many times. So, we just have to brush it off and find the next pattern.

Summary:

Entered: Jan 220/230 Call option spread for .63 on 11/30/21.
Expired: .00 on 1/21/22
Net $-63.00 loss. This is why you don't cost average on losing positions. If I went solely with a conviction this would work out, then I might have added more long positions as the stock made new lows. Thank goodness I've learned not to do that.


Wednesday, January 19, 2022

March Soybeans Formed a Bearish Gartley - Update 1


Wow, that happened fast. Yesterday we had a nice Bearish Gartley pattern, today we had a strong reversal. Today's candle combined with yesterday's candle forms a "Doji Gap Up" candlestick pattern. This is a strong indication of a change in investor sentiment.

When price crossed the 8ema and continued strongly, I decided to avoid greater losses and get out. At 9:36am ET I Tweeted "Dumped the March Soybeans Futures. Details later.". I watched the chart periodically during the day, looking for a reversal but it never came. 

I think exiting was the right strategy, but there's still hope. We're still in a Gartley pattern that hasn't failed. It hasn't even invalidated the D3 point. Neither have we violated the downward Trend Line you'd get if you connected the candle tops for the past 7 days.

I see four likely scenarios from here:

  1. We quickly start heading back down.
  2. We briefly continue upward but reverse back downward before violating the D3 point.
  3. We form a new D point and head back down before violating the X point.
  4. We violate the X point and set up a Butterfly pattern.
Because I have no idea which of these will play out, or some other scenario, I don't want to reverse our position to a long trade. Since we don't have an edge, it's better to just monitor the chart until we see a high probability opportunity.


Ag Reports Cut the Corn - Exit


In my original post for this thread, I wrote "Triangles are notoriously unreliable, in that the price can break out one way and quickly reverse and break out to the opposite side." Well, here's a @#$%^&*! example.

We had bounced off the 50sma on the Daily chart above and formed a Bullish Harami candlestick pattern. Next day we closed over the 8ema, then today we continued up, violated both of the Triangle Trend Lines, and hit our Stop at 612. Total change of the investor sentiment compared to what we saw in response to the major USDA report released 1/12/2022.

Can't expect to win them all. That's why, no matter how good you feel about a setup, you need to use position sizing such that your Stop won't cost you too much. We should place our Stop where it belongs, then protect ourselves by adjusting the position size accordingly. 

Summary:

Entry: 587 3/4
Exit: 612 1/2
Net:  587.75 - 612.5 = -24.75 * $10/pt = -$247.50

Tuesday, January 18, 2022

March Soybeans Formed a Bearish Gartley


Been trying to catch the D point on the Daily chart above. The first two, D1 and D2, failed but D3 led to price action breaking through the 8ema and closing below it with confirmation, which gives confidence this is the one. Its looking so weak, I decided to get in short, even though we're pretty far from the 1415 D3 point already. Even down this far, we still have a good Risk/Reward. More on the R:R later.

The proper Stop for a Gartley pattern (aka XABCD) is just above the X point, but that represents too much potential loss (Risk) if we hit it. So, we're using the recent swing high (D3) instead of the X point.

The Target is the usual .618AD, which is the 61.8% Fibonacci retracement of the A point to D point range. You can find all the Targets to consider in the box on the chart.

So, right at the Close today, I shorted a YK mini-contract at 1361 1/4.

Summary:

Entry: 1361 1/4
Stop: 1416
Target 1279 (shaded a little from D3 point to allow for slippage and the Bid/Ask spread)

Risk: 1416 - 1361.25 = 54.75 points * $10/pt = $547.50
Reward: 1361.25 - 1279 = 82.25 points * $10/pt = $822.50
R:R = 822.5/547.5 = 1.5:1 which is actually quite good if you consider the Gartley pattern has a 75% success rate at the .618AD Target.


Ag Reports Cut the Corn - Update 2


Today's candle is even worse than yesterday's. We started with a gap down Open last night, which was very encouraging. But we ended the day closing over the 8ema, which can be considered confirmation for yesterday's Bullish Harami candlestick pattern. Not good.

However, we stayed under the 20sma and the downward angled Trend Line, as well as the upward angled Trend Line of the Triangle that we had broken through. Volume is the same as yesterday and Stochastics have been in the mid-range for about 15 candles. So no helpful insights there.

Should we stay, or should we go? Since its not unusual to reverse and retest a support area or Trend Line after breaking though it, and today is only Tuesday, and I don't see any significant grains reports through next Monday, and we have a hard Stop in place above us (612) for protection, I decided to hold on another day. Normally, a continued move above today's high would give enough confirmation to exit a short trade, but I think its reasonable to allow it, up to where we'd test the downward Trend Line. If we look like we're going to close over that, then we should get out.

I checked Wheat and Soybeans. Wheat made a very Bullish move today, while Soybeans look so weak, I took a short position. So we didn't get a clear signal on the grains to help with our decision.


Friday, January 14, 2022

Ag Reports Cut the Corn - Update 1


Certainly not what we wanted to see nor what I expected. Technically we bounced off the 50sma and formed a Bullish Harami candlestick pattern. These are Bullish indications.

However, we didn't breach the 8ema and we had somewhat lower volume today. Perhaps the big traders took today off to get a 4 day weekend. Also, its natural to have some profit taking after a strong move and before a 3 day weekend. Its also natural to test the underside of a Trend Line you broke through. We didn't get up as far as the Trend Line but we did make a move towards it.

Emotionally, I definitely wanted to exit this trade today and not take the risk of a big gap up after 3 days of no access to the market. However, I exercised my discipline and decided it was worth the risk to allow a counter-move. Using the mini-contract helped mitigate the fear of being out of control over my risk.

It also helped a lot not closing over the 8ema.

Bottom line, I held our Bearish position.

Thursday, January 13, 2022

Ag Reports Cut the Corn


Yesterday 1/12/22 at 12:00pm ET there was a big set of Agricultural reports released. You can see the reports schedule here:

https://www.usda.gov/media/agency-reports?start_date=1%2F11%2F2022&end_date=01%2F14%2F2022

Here's the list of reports that came out yesterday:

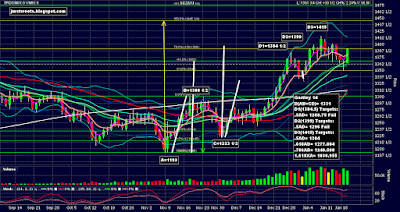
As often is the case, the chart above is quite busy. Please focus on the green text boxes.

The response to the release yesterday was a long legged Doji candle. This represents indecision. My interpretation is the market needed to digest the information longer than the time left before the Close.

I waited until just before the Close today to check today's price action. As you can see on the Daily chart above, we have a very small wick on the top of the candle followed by a relatively large red down candle, and a close near the bottom of the candle. I interpret that to say the market digested the reports and decided it was Bearish. Who am I to argue.

Over the past few weeks, you can see we rejected off a confluence of Fibonacci levels from 4 different ranges. The high was 617 3/4. Then we formed a triangle going into the big reporting day, which makes sense. The resolution is a break out to the downside. Triangles are notoriously unreliable, in that the price can break out one way and quickly reverse and break out to the opposite side. However, given that the break out is in response to the reports a day after the release, I think we can reasonably expect this is the beginning of a down trend.

Also, notice the significant volume yesterday and today. This looks like the market is serious about this price action. 

Notice the triangle pattern led to a Bollinger Bands/Keltner Channel Squeeze. We haven't broke out of the BB/KC yet, but if price continues down we will. If we break out of the BB/KC we can expect 5-7 days of continued momentum to the down side after the break out.

Stochastics are in the mid-range, so we have some runway here before we need to start worrying about being oversold.

OK, let's consider Targets. In the triangle you'll see 2 thick, green, down angled lines. This illustrates an AB=CD pattern. The calculated D point is 578.25. This coincides with a clone of the triangle top trend line that is positioned at the low of the triangle.

Let's look at Fibonacci levels based on the whole up leg since 9/9/2021 with a low of 506 3/4. The top of the up move is the high of the triangle at 617 3/4. A 50% retrace down is 562.25, and the 61.8% retrace is 549.152. The calculations are shown on the chart in green.

There is a 200sma (thick, white, up angled line) which looks like it might be flattening out at 562 1/2.

I like that the 50% retracement (562.25) and the 200sma (562.5) are very close to the same level. So this seems like a good target for now.

I'm going to use a Stop just above the previous swing high within the triangle at 611 1/4.

Just before the Close at 14:13 ET I sold a YC mini-contract for 587 3/4.

Summary:

Entry: 587 3/4
Stop: 612
Target: 563

Risk: 612 - 587.75 = 24.25
Reward: 587.75 - 563 = 24.75
R:R = 1:1 which isn't great, but I consider this to be a high probability trade, which makes it acceptable.

Wednesday, January 12, 2022

High Risk March Wheat Long - Exit


Above is the Daily chart at 10:46am ET. I was looking for an up move into the 12:00pm Ag reports, but we were just stuck in place waiting for the reports. So after waiting over an hour, I decided to get out because it seemed very likely we would continue to stall until 12pm.

I sent the following Tweet at 10:46

"Bailed on the Mar Wheat Futures trade. We're just gonna stay in this tight range until the report comes out at 12pm ET. Just sold for 764 1/2 for a 4 1/2 point loss."

Since I used the mini-contract, that's 4.5 pts * $10/pt = -$45. Not bad for a high risk trade.

Then at the Close, the Daily chart looked like this:


It looks like maybe we're heading back down, but we didn't form a candlestick sell signal, and Stochastics are in the mid-range. Plus, Corn is neutral and Soybeans are going up!

So, I'm not ready to get back into Wheat again yet.


Tuesday, January 11, 2022

Citi Group Gartley Pattern - Exit


On the Daily chart above you can see we had a great day. We gapped up at the open and closed nicely higher. This formed a Trend Kicker candlestick pattern. This is a very Bullish indication.

However, Stochastics are extremely over bought and we've been climbing with a relatively steep slope.

The Earnings Report (ER) is 8am ET 1/14/22. If anyone who held profitable options wanted to cash out before the ER, they would have to sell by 4pm on the 13th because the options market doesn't open until 9:30am. It would be reasonable for traders to sell their Citi stock and options ahead of the rush. So, I'm concerned we're getting too close for comfort.

Also, you'll see on the chart a thick, white, horizontal arrow pointing back to a congestion zone this past November. Current price has now entered that same zone, which can act as resistance.

The Jan 60 Call option we got for $3.40 was worth $7.20 near the Close today. That's better than a 100% gain.

Given all of the above, even though we can easily get more upside tomorrow, I decided the best idea is to capture the profits we have today. So, I sold the Call for $7.20 at 3:50pm ET. Then I Tweeted it out as fast as I could in case anyone wanted to know while the market was still open. I see the stock price is even higher than today's high in after-market trading. So, if you didn't sell your option today, you'll probably get more for it tomorrow.

Summary:

$720 (1/11/22) - $340 (1/3/22) = +$380 profit.
380/340 = 112% gain in 8 calendar days.

High Risk March Wheat Long


Like the title says, this is a high risk trade at the time I entered it, which was at the Close today for 769. One reason its high risk is because we don't have confirmation yet, which would be a higher Close, or higher high and higher low, by the next trading day or two.

But a much greater reason for high risk is that the quarterly "Grains Stocks Report" is due out tomorrow 12:00pm ET. This can whipsaw the grains markets, and unless you hire Mr. Beeks, the reaction to the report is a craps shoot. So we do not want a position in the market at 12:00pm.


Must See Movie "Trading Places"

However, due to what I see on the Daily chart above, the odds suggest we should get some more upside, at least up to the Report release. Here's what I see (yellow box on the chart):

  • Bullish Engulfing candlestick pattern
  • Doji Sandwich candlestick pattern
  • Close over the 8ema
  • Low Stochastics
  • Tweezer Bottom candlestick pattern
  • Support from Head & Shoulders half measured move 1st Target
  • Support from AB=CD 760.50 D point
  • Support from 200sma
Since its a high risk trade, I'm using a tight Stop of 747, just under the bottom of the previous Doji candle low. Also using the YW $10/pt mini-contract.

For the Target, I'm looking at the 808 1/2 end point of a clone of the previous leg up. See the thick, forward angled, yellow lines. But I'm shading it a bit to the 50sma, which coincides with the Head & Shoulders Neckline, at about 795.

IMPORTANT: I'm setting an automatic conditional order to sell the position, no matter what, at 11:45am ET.


Monday, January 10, 2022

Citi Group Gartley Pattern - Update 5


We gapped up at the Open, filled in the gap and tested the 3ema. Then we reversed upward and closed over the previous Close. And we made a higher high and higher low compared to the previous trading day.

Even though we have a red candle body today, it was clearly a Bullish day. Definitely wanted to hold the position.

However, the Earnings Report (ER) is in 4 days. Our options should have increasing Implied Volatility (IV) due to the approaching event as well as the overall market dynamic activity. Option Gamma should also be increasing. These are Bullish for option pricing. But Theta time decay is also increasing, Stochastics are very overbought, and traders may want to sell ahead of the ER to capture their recent profits. These are Bearish.

So, while I seldom use Stop Losses on options, today I added a Stop Loss at break even on our position.


Friday, January 7, 2022

Citi Group Gartley Pattern - Update 4


Above is a wide view and zoomed in view of the Daily chart. We had a continuation day in our favor, which is good, but I'm becoming concerned about the overbought Stochastics. I mentioned it last time as well.

Our Target of 71.62 is on the other side of the 200sma. The 200sma could easily provide enough  resistance on its own to send us back down for a retrace before reversing back up. But combined with the Stochastics being overbought, its even more likely. 

This would be problematic because the Earnings Report is on 1/14/2022 before the market opens, which means we need to exit by the Close on 1/13/2022. A reversal could have us down significantly right when we have to exit.

So, considering this situation, I think I'll exit this position if we hit the 200sma instead of waiting for the .618AD Gartley Target. The 200sma at today's close is exactly 70.00. 


Thursday, January 6, 2022

Citi Group Gartley Pattern - Update 3


Excellent day for our long position. We gapped up and formed a Trend Kicker candlestick pattern. Then we closed over the 50sma on good volume. Also notice how well the Bollinger Bands are blossoming. All Bullish indications.

We're nicely on track. The only thing that's concerning is how high the Stochastics are. The Stochastics recently pinned on the bottom side from Dec. 1st to Dec. 21st, so why can't it pin on the upside for us now?

Wednesday, January 5, 2022

Citi Group Gartley Pattern - Update 2


Well, we certainly didn't make a higher high lol. We did open gapped up, but the Federal Reserve FOMC Meeting Minutes came out at 14:00 ET, and down we went, continuing to bounce off the 50sma. But, we stayed above the 3ema and closed right on it. And today's volume was less than the past 2 days. No need to exit the trade based on today's price action.

The equity markets went down on the prospect of higher interest rates, but higher interest rates help banks be more profitable by increasing their Net Interest Margin (NIM) (see https://www.investopedia.com/terms/n/netinterestmargin.asp#toc-what-is-net-interest-margin). But I don't want to get into fundamentals. I'm a technical trader and want to stay that way. Only bringing this up to say, I'm not ready to give up on this trade yet.

Tuesday, January 4, 2022

Citi Group Gartley Pattern - Update 1


We gapped up above the Trend Line, continued higher but rejected off the 50sma and closed the gap. Nothing in this price action violates our Bullish thesis.

It's constructive that we closed right on the Trend Line vs below it. My expectation is we make a higher high tomorrow. Held the long position.

Paypal may be a friend again - Update 12


There goes yesterday's joy. Today we formed a Bearish Engulfing candlestick pattern. But we also gapped up at the Open, and didn't close below the 8ema. So, no real damage done.

We're still chopping around in this consolidation. Have to remain patient and continue monitoring.

March Wheat did an about-face - Exit


Very difficult decision today at the Wheat market Close.There were reasons to exit and reasons to hold.

The top chart is the Daily chart after the Close. We formed a Bullish Harami candlestick pattern and closed over the 3ema. The 3ema is like a proxy for the 8ema when price is far from the 8ema. Also, we bounced off the previous swing low from mid-December. If we get continuation in the next couple days we will most likely lose all our profit and could feasibly hit our Stop for a loss.

However, we're still under the 8ema, and should therefore hold the position and see what happens tomorrow. Stochastics are low but not very oversold. Also, The BB/KC break out to the downside is just beginning. Not to mention all the Bearish indications that got us into this trade.

So, I zoomed into the 15 minute chart, which is the 2nd chart above, to get more perspective. You can see price is up against resistance from both the 200sma and the 61.8% Fibonacci retracement level. Stochastics are significantly overbought. These suggest price is likely to reject this level and take a dive back down. But it didn't. It didn't break through to the upside either. It just got lodged between the 8ema and the resistance level. Now look at the volume. A huge spike in the last 15 minutes. Since price barely moved in that volume spike, it shows there was a big battle between the bulls and the bears. So the market couldn't decide either, and I wasn't getting any clearer message from the 15 minute chart.

What else could I do to get some insight? I looked at the other grain charts:


The upper chart is the March Corn Daily, and the lower chart is the March Soybean Daily. These looked like they were likely to continue upward for days. Look at Soybeans. It made a new high and closed near the top of the candle!

Looking at these convinced me we needed to exit our Bearish position today, capture what profits we were fortunate to still have, and monitor the March Wheat chart going forward to see if we should re-enter short.

I Tweeted at 13:57 ET:

"I may exit our Short March Wheat Futures position before the 14:20 ET Close today. Watching the 15 minute chart, which is at a critical level."

At 14:11 I Tweeted:

"I'm out of the Short March Wheat Futures position at 770. Details after the Close."

Bottom line:

Shorted: 790 12/29/21
Covered: 770 1/4/22

Profit: 20 points * $10/pt (YW mini-contract) = $200 (Full size would be 20 * $50 = $1,000)

Monday, January 3, 2022

Citi Group Gartley Pattern


Both charts above are Daily charts. The top chart is widened out to see the Gartley pattern. My own research has proven to me the Gartley pattern has a fantastic success rate of approximately 75%. I define success as hitting the .618AD level before breaking the X point level.

The bottom chart is zoomed in to see the Doji Gap Up candlestick pattern made by today's candle and the previous candle. This formed on high volume. This is a very Bullish indication.

On the zoomed in chart, it also looks like we're forming a Fry Pan Bottom candlestick pattern. If we break out of that to the upside, that would be a very Bullish indication.

So, based on the above, I got a Jan 60 Call for $3.40. I know that Theta time decay is relatively high given that there's only 3 weeks left until expiration. To deal with that, I plan to turn this position into a Call Spread after a sufficient increase in the stock price. If I can sell a 72 strike Call option for $3.40 then I'll have a risk free trade.

The good thing about being close to expiration is that Gamma is also high. So if the stock price rises, the option value will rise quickly.

The Quarterly Earnings Report is due out Jan 14th at 8am ET. I plan to close this position before then. If the target isn't hit by the ER, then I'll sell the option on the afternoon of the 13th, which should enjoy a boost in Implied Volatility.

Since we have defined risk, thanks to using options, I'm not very concerned about a Stop. If I had the stock, I'd put the Stop just under the D point of the Gartley, or if I could afford the potential loss, a better spot would be just under the X point of the Gartley.

For the Target, I'm using the .618AD Fibonacci retracement level, which is 71.62.

Paypal may be a friend again - Update 11


Today's price action doesn't look like much, but there's something happening here that could be meaningful. Take a good look at today's green candle and the previous trading day's red candle.

Today's candle opened well above the previous candle's close. Then we climbed and closed above the recent congestion. Technically we didn't form a Trend Kicker but we came close to it. We are also approaching the break out level of a Fry Pan Bottom candlestick pattern.

In addition, the Bollinger Bands have pulled inside the Keltner Channel, setting up the possibility of  a BB/KC Squeeze breakout.

These indications, plus Stochastics still in the mid-range, are encouraging to our long thesis.

Feb Gold May Flutter South - Exit


Wow! What a gift that was :) Price went up just a little over the 127.2% Fib Extension and established the D point of the Butterfly pattern at 1833. That yielded a Target of 1805.87, so I didn't need to change yesterday's estimated initial Target of 1806.

Then we drifted down followed by a slight pull back. Then the bottom fell out and we accelerated down to the Target and then some. In fact, we even hit the secondary Target of the .786AD Fibonacci retracement at 1798.50. The low as of 15:15 ET is 1798.20.

Summary:

Entry: 1830
Exit: 1806.50

Profit 23.5 points * $10/pt (mini-contract) = $235. The full contract, at $100/pt, would have been $2,350.


March Wheat did an about-face - Update 3


Very good day for our short Wheat trade. On the Daily chart above you can see:

  • We set a lower high and a lower low.
  • We went lower on increased volume.
  • You can see the bottom BB has separated lower than than the KC.
  • Each of the last 3 candles have bigger bodies, showing an acceleration.
  • Stochastics are not yet oversold.
All of the above are constructive for our short thesis. However, we are very close to previous support at 751. Tomorrow will be very important to see if we breeze by the previous swing low, or react to it and get a pop. This made me want to cash out our current profits today, which are relatively attractive. But that could be a big mistake if price continues its cascading drop off.

Another thing that made me want to take profits was Soybeans. Corn continued to look Bearish but Soybeans did a Doji Gap Up off the 8ema on high volume, which is quite Bullish. This gives me concern, but we have to remember while each of these grains are in the same commodity class, they are also different markets.

Just the fact that I'm looking at a nice profit that I don't want to lose is enough pressure to want to exit. But that's to be expected and a trader must be able to deal with that emotion, or they're doomed to keep leaving more money on the table than they should.

So, at the market close, I had to suck up my fears and go with the odds, which is to leave the position on.

However, I think the 729 target might be a little low. The D point of the white AB=CD is 730.50, and the 200sma has risen to 728.93. So, I raised the Target to 732.