Thursday, July 29, 2021

Fly United to Gartleyville - Update 2


We're still bobbling around the confluence of the 8ema (orange), 20sma (green), and 200sma (white) moving averages. We closed just above the 8ema. 

The gap in price on the daily chart between 7/20/21 and 7/21/21 might be calling our name, but our plan is to stay long, so long as we don't violate the  X point at 39.17. Our risk is limited to the cost of the Call option.


Tuesday, July 27, 2021

Fly United to Gartleyville - Update 1


Today it looks like we're in a bobble between the 20sma, 200sma, and the 8ema. This is normal and may last a few days. We closed above the 200sma and 8ema, so I don't see a threat to the long position. Although, we did form a Bearish Harami candlestick pattern, but since Stochastics are still in the mid-range, the pattern doesn't carry much weight.


Dec Corn Gap Fill Rejection - Exit


Last night at 20:00 ET, when the grains market opened for the new day, price gapped up. You can see this on the top chart above, which is a 15 minute chart. The bottom chart is a daily chart. Both were saved after the end of the day.

A gap up is usually a bullish indication. But you can see after the first 15 minute candle, price started heading downward. So I held the short position, made sure the Stop and Profit Taking orders were working, and let the market work while I slept.

Next morning I saw price had reversed and was heading up. I decided to wait for the 9:30 ET market open and see what happens. As you can see the market surged upward and surpassed the previous swing high. This looked ominous after having gapped up at 20:00 last night.

So, given this was a higher risk trade, as I mentioned in the original post for this thread, deciding to exit the trade seemed like the best course of action. Covered the short at 9:39 558 1/4.

On the daily chart you can see we came back down and closed under the 8ema, and also under the 3ema. But today's candle has a higher high and a higher low compared to yesterday. I considered re-entering the short trade, but after today's price action, I think the best action is no action. Not the best idea to trade inside a consolidation anyway. Going to monitor the situation but move on to higher probability setups.

Summary:

YC Dec futures
Shorted: 544 1/4
Covered: 558 1/4
Loss: 544 1/4 - 558 1/4 = -14 * $10/pt = $-140


Monday, July 26, 2021

Fly United to Gartleyville


See the Gartley pattern on the UAL daily chart. You can see the X, A, B, C, and D points clearly marked on the chart. We also formed a Morning Star-like candlestick pattern and closed over the 8ema as well as over the 200sma. We completed the AB/CD within the XA range very close to the 78.6% Fibonacci retracement. Stochastics are mid-range. This is a Bullish set up.

A possible problem with this trade is how price gapped down on relatively high volume into the 78.6% Fib. This is an indication of high momentum to the downside, and it would be more conservative to pass on a trade with this characteristic. The risk is we don't reach our .618AD target before reversing and heading back down. If we get substantial resistance before hitting our target, we should get out early, or at least move our Stop to break even.

Another source of trouble is the possible resistance from the 20sma (green), which we closed directly on today, as well as the 50sma above (red).

Bought a UAL Aug 50 Call for $1.97 just before the market close when the stock was 49.48 and the Delta was 48%.

We'll exit if we violate the Gartley pattern by dropping below the X point at 39.17. If this happens, we'll monitor this chart for the formation of a Butterfly pattern.

Targeting the .618AD level, which is 42.56+.618(63.70-42.56)  = 55.62

Summary:

Entry 49.48 (Call option $197)
Stop 39.15 (shaded by 2 cents)
Target 55.60 (shaded by 2 cents)

By Stock:
Risk: 49.48-39.15=10.33
Reward: 55.60-49.48=6.12

By Option:
The Delta was about 50%. $10.33 stock risk * 50% = $5.17, but risk is capped at the cost of the option, which is $1.97. Reward is about 6.12 * 50% = $3.06. So, for our option position,
Risk: 1.97
Reward: 3.06
R:R = 3.06/1.97 = 1.6:1 which isn't great but hitting the 61.8% Fib as a target on a Gartley pattern is a high probability trade, at least in my experience. So this R:R is acceptable.

Dec Corn Gap Fill Rejection - Update 1


We made a lower high and a lower low, and we closed under the 8ema. Stochastics are still in the mid-range. These are constructive for our short trade.

Unfortunately, we formed a Doji candle today. This represents indecision or uncertainty. A nice red candle would have been preferable but while a Doji causes one to pause and fear the next candle will begin a reversal,  its certainly not a reason to exit the trade at this point.

No doubt we should hold the position tonight.


Friday, July 23, 2021

Dec Corn Gap Fill Rejection


December Corn futures daily chart shows the gap was filled on 7/21/21. The next day we started downward. We formed an Evening Star-like candlestick pattern followed by a follow through and close below the 8ema. Looking at the last 7 candles on the chart, we formed an inverted Scoop pattern. We did all this on "normal" volume. Stochastics are mid-range so there's plenty of runway to go lower, but unfortunately we don't benefit from oversold pressure. 

This is a reasonable setup for a continued move to the downside. However, we are right smack in the middle of this consolidation. So that makes this a rather risky setup.

Regarding the target:

The white, thick, curved line, angled upward, is the 200sma. You can see its approaching the 78.6% Fibonacci level.

Notice the X, A, B, and C points labeled on the chart. This is the possible setup for a Gartley pattern. We haven't formed a good D point yet. The point where D would reach AB=CD is shown on the chart as 490 1/2.

Notice the thin white lines forming a Wedge pattern. This outlines the consolidation and price has been constrained within the wedge. Its reasonable we'll get close to the bottom of the wedge, if not touch it or break through it.

Each down leg is represented by a different color. You can see each of the 3 down legs is shorter than the previous leg. Its reasonable to expect this new down leg will also be shorter than the previous leg, shown in light blue.

So, possible targets (with approximate values):

  • Wedge bottom: 512 1/2
  • D(AB=CD): 490 1/2
  • 78.6% Fib: 489 7/8
  • 200sma: 489 7/8
Since we're in a risky trade, due to being in the middle of the consolidation with mid-range Stochastics, we want to use the most conservative target, meaning the highest in this case.

I entered short on the Dec YC mini-Corn futures contract ($10/pt) at 14:13 ET. I waited to make sure we were going to close near the bottom of the candle, which is another bearish indication.

However, guess what? I didn't know the market hours for the Corn market had changed. The close was at 14:20 ET for as long as I can remember, but I learned today the market now closes at 14:45 ET. So I could have waited a little longer. I tried to find when the schedule was changed but couldn't. After about 15 minutes of searching I stopped.

I placed the Stop just above the top of the gap.

Summary:

Entry: 544 1/4
Stop: 575
Target: 512 1/2

Risk: 544 1/4 - 575 = -30.75 * $10/pt = $-307.50
Reward: 544 1/4 - 512 1/2 = 31.75 * $10/pt = $317.50
R:R 1:1 This is actually a bit low given this is not a high probability trade. You could argue we shouldn't take this trade, but I can live with a 1:1 ratio.

Soybean 15 minute Scalp - Exit


Shot through the heart
and beans to blame
Scalps give trading
a bad name.

   - Bon Jovi

Its very risky to enter a trade pre-market just before the open. Case in point. Chart looked great, but everything often changes when the market opens. Expect to lose trades like this.

Summary:

Enter: 1392 7/8
Exit: 1400 7/8
Loss: $-80

Tuesday, July 20, 2021

Soybean 15 minute Scalp


See notes on chart. Entered short using YK mini contract ($10/pt) at 1392 7/8 on 15 minute chart right before 8:45am ET break. Price came close to a 61.8% Fib retracement.

Market re-opens 9:30am. If it breaks above the double top by more than a little, then I'll exit quickly and look to possibly re-enter short at the 78.6% Fib.

Entry: 1392 7/8
Stop: 1413 above 78.6% Fib
Target: 1358 at the -27.2% Extension

Wednesday, July 14, 2021

Corn Dec Hourly Inverted Head & Shoulders - Exit


The chart above is an hourly chart after the corn market closed. You can see our 560 target was hit and the Inverted Head & Shoulders measured move was fulfilled with shockingly accurate precision. However, there was a rejection of a 200sma on the 4 hour chart. It looked like this rejection may well be the top of this price move for the rest of the week, so I got out a little earlier than than the planned target at 560.

At 9:39am ET I sent the following Tweet and 1 hour chart:

"December hourly Corn Futures hit 1st target. Moved balance of position to breakeven at 540. Next target 560." 


At 10:59am ET I sent the following Tweet and 4 hour chart:

"December hourly Corn Futures exited a little early at 556 1/2 vs 560 because I looked at 4 hr chart and saw the 200sma was sitting just below the target, and price rejected off it. Nice profit from this trade."


I was not expecting to hit our targets today, but I'm very happy we did. There's a good chance price will continue upward to fill the gap, but we may take a bit of a dip first. Notice how overbought the Stochastics are. So, I want to take a break here and see how the chart behaves from here.

Summary:

1 YC Dec Fut 547 - 537 1/2 = 9.5 * $10/pt = +$95
1 YC Dec Fut 556 1/2 - 539 1/4 = 17.25 * $10/pt = +$172.50

Profit $95 + 172.50 = $267.50

If we used the full ZC contract at $50/pt, the profit would have been $1,337.50


Tuesday, July 13, 2021

Corn Dec Hourly Inverted Head & Shoulders


Sent this Tweet 9:31am ET this morning:

"Dec Corn broke inverted Head & Shoulders this morning on USA CPI Report. We're long with first Target 547."

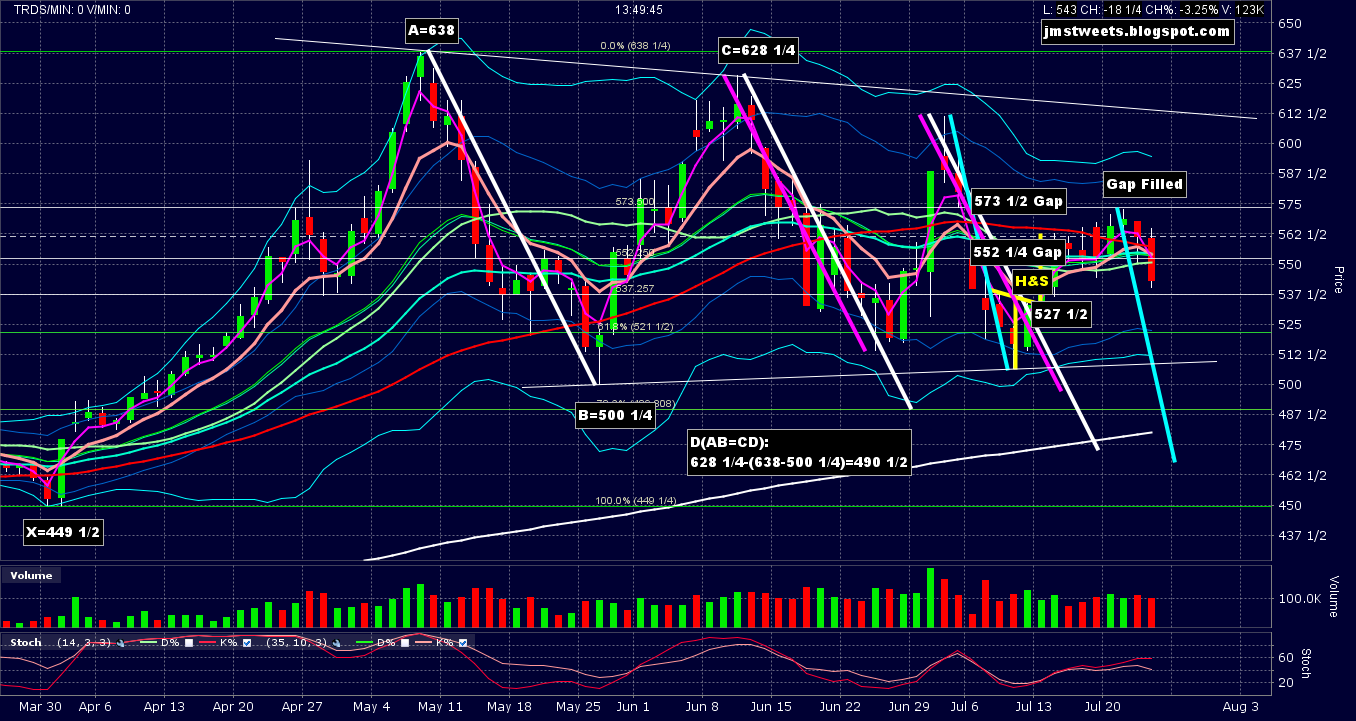
Here's the 9:27am ET chart I sent with the Tweet:


You can see on this chart at the market open that price had broken through and closed above the Inverted Head and Shoulders neckline. The upper, thick, yellow, vertical line is the measured move for a Head & Shoulders pattern. The thin, yellow, horizontal line is the halfway point at about 547. I have found that many more Head & Shoulder patterns reach the halfway point than the full extension. So I like to set the first target to the halfway point.

The top chart is the Daily chart and the chart underneath it is the Hourly chart. Both were captured after the close. On the Daily chart and the early morning chart you can see there was a gap down from 573 1/2 to 552 1/4 from 7/2/21 to 7/6/21 over the Independence Day holiday.

Since open gap's like to be filled, and we have an Inverted Head & Shoulders breakout, its a reasonable expectation for price to continue up into the gap.You'll also notice the I.H&S breakout is also a Frypan Bottom breakout.

The top 2 charts show price closed over the 8ema on the Hourly chart as well as on the Daily chart. On the Daily, we also had a Hammer candle on overbought Stochastics followed by a Bullish Engulfing candle.

All this suggests we have a significantly bullish set up. Even though, it is normal to briefly reverse and retest the neckline before continuing upward. We may get this tonight when the market re-opens at 8pm ET.

We entered long 8:41am ET at 537 1/2 using the YC Dec futures contract. Went long another one 9:49am at 539 1/4. Set the first target at half the I.H&S measured move at 547. Set the second target at 560, which is just under the full measured move. I think there's a good chance we'll go higher and get close to the top of the gap at 573 1/2, but I want to see what the price action looks like after the second target is hit before adding a third contract.

Today's high on my Interactive Brokers ZC chart shows as 547. Our target was 547 but the sell limit order wasn't triggered. Maybe its the difference in the Bid/Ask spread on the YC contract vs the ZC contract, but I did shade the actual target from 547 1/2 to 547, which should have taken care of a 2 tick price difference. Well, the drawing of the measured move is a bit of an inexact construction anyway, but to hit 547 on ZC and not trigger our order is quite frustrating. Bottom line is we're still long 2 contracts.

On the Hourly chart you can see we got some resistance from the 200sma. If we're going exit with a profit we'll have to get through and close over that line. But the 200sma is often a powerful support/resistance level which is respected by the price action. This means its likely we'll head back down to the neckline. Then the crucial retest will tell us if we continue back up towards our targets, or not, which would mean the halfway point of the measured move is all we get, and I've seen that happen in the past.

I set the Stop to 526 which is just below the 527 1/2 most recent swing low.

Summary:

Bought 1 YC Dec Fut 537 1/2, Stop 526, Target 547
Bought 1 YC Dec Fut 539 1/4, Stop 526, Target 560

Risk: ((537.5-526)+(539.25-526))*$10/pt=$247.50
Reward: ((547-537.5)+(560-539.25))*$10/pt=$302.50
R:R=302.50/247.50=1.2:1 Not great but acceptable on a high probability setup.


Thursday, July 1, 2021

BLI Stock Short - Exit


12:11pm ET I Tweeted:

"Bailed on our $BLI #BLI short position due to a bit of a reversal this morning but mostly due to NFP tomorrow morning. Normally I'd wait for the close to make a decision but wanted to get out at break even while I could, since I didn't want to risk NFP with a naked short, and knew I was getting out anyway."

If it wasn't for a major economic report due out tomorrow morning before the stock market opens, I'd wait to see if BLI closes above or below the 8ema. If it closed on or below the 8ema I would have held this short position. This little reversal could be a normal retest of the 8ema, which would normally be followed by continuation to the downside.

But the Non-Farm Payroll Report is a crap shoot. And when price was at break even, I decided I definitely wanted to exit by the end of the day. Not knowing where price was going from 12:11pm it seemed like a smart decision to get out now rather than wait for the end of the day, as I usually would.

Summary:

Shorted: 20 @ 46.85
Covered: 20 @ 46.60
Net profit: $0.25 * 20 = $5.00