Tuesday, June 30, 2020

Dec Corn Big Bullish News


I sent a Tweet out at 7:40am ET this morning "Dec #Corn #Futures looking bullish this morning. If it still looks bullish at the close I'll probably go long.".

Dec Corn Futures started popping yesterday but didn't close over the 8ema. Today at 12:00pm ET we had a high impact crop report. The "Acreage" and "Grain Stocks" reports. I use the following link to see what reports are coming out:

https://www.usda.gov/media/agency-reports?start_date=06%2F29%2F2020&end_date=07%2F03%2F2020

As a technical trader I try to give very little weight to what the report says, and give much weight to how the market reacts to it. I've seen markets go up on good news and down on good news as well as going down on bad news and up on bad news. So the market has taught me its not the news, its the reaction that matters.

Yesterday and the day before formed an Bullish Engulfing candle pattern with Oversold Stochastics. Today we broke through and closed above all of the Moving Averages we follow, except for the 200sma. And we did it on very high volume.

Also, the candles from 6/8/20 through today form a Scoop pattern. Here's a description of the Scoop Pattern:

https://candlestickforum.com/identifying-candlestick-patterns-stock-market-graphs/

Even though the last Corn trade failed, this setup looks like a good one and we have to enter the market with a long position. You have to accept some trades will fail, even if you have a methodology with an edge and a positive expectancy, and your execution is flawless.

However, I am a little concerned about how the market went down before bullish news and the market popped the day BEFORE the report. Read between the lines here. Farshtey?

So, I decided to risk less by using a Call Option or a Mini Contract. I decided to use a Mini Contract to avoid Theta decay and Implied Volatility Crush. This setup looks very strong to me, so I'll take the higher risk of a futures contract vs an option. The symbol for the full $50/point contract on my IB TWS platform is ZC. The symbol for the $10/point mini contract is YC. (Also, I'm spread a little thin with additional trades in wheat and natural gas. I'm not blogging the wheat trade because its very similar to the corn trade but the setup isn't as good. I'm not blogging the natural gas trade because I never traded natural gas before. If you're curious, both trades are long.)

I was filled at 350 3/4 on the Dec YC futures. I use the ZC chart even though I'm using the YC contract. The ZC contract has much more volume and is the "real" contract.
The target is the 61.8% Fib retracement at 373 1/4.
The stop loss is just under today's open at 333.

Risk: 350 3/4 - 333 = 17 3/4.
Reward: 373 1/4 - 350 3/4 = 22 1/2.
R:R 1.27:1 (Not so good. But it looks like a high probability trade and a relatively short term trade, like maybe 1-3 days. Also, I may increase the reward by adding contracts and/or extending the target to the 200sma.)

Sunday, June 28, 2020

Dead man walking.

Number of zombie corporations increasing. If interest rates rise or their credit is reduced they will die. If zombie corporations fail expect unemployment to skyrocket.
US corporate debt approaching half of GDP - a new record. If consumer spending doesn't come back sufficiently, we'll have more zombie companies or bankruptcies.
Weekly Initial Unemployment Claims for week of 06-20-2020 still close to 1.5 million. What does that say about consumer spending, which is 70% of GDP?
Unemployment as of May 2020 is 13.3%. What does that say about consumer spending?
Largest public debt in world history. Enabled by a reserve currency backed by nothing that's fallen in value by over 96% since its inception.
Here's the government's US Bureau of Labor Statistics data showing you the purchasing power of the US Dollar has fallen by over 96% since its inception.
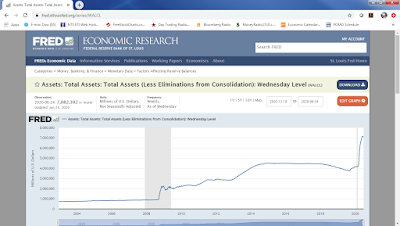
The Federal Reserve has the largest amount of currency, that it created out of thin air, than any central bank in the world and in history. Supposedly it will be reduced when the debt instruments it bought are paid back to the Fed. But the borrowers are in no condition to pay them off.

The US has gotten away with financial murder because of the demand for the US Dollar and the trust in the solvency of the USA. But we're not solvent and ironically our country's behavior is reducing the demand for our dollars.

The US has used its currency as a threat against other countries to coerce them to behave as we wish. The reaction has been for countries that don't want to be controlled by the USA to find ways around the need for the US Dollar. This is all documented public knowledge, not opinion. The result is diminishing demand for US Treasuries. So the Federal Reserve has taken up the slack by printing dollars, diluting the dollar's value, and buying US Treasuries. Then the US repays its debt with cheaper diluted dollars.

This has been working because of the confidence in the Dollar. But sooner or later the deserved confidence built through history will be lost when its realized today's USA is not the USA of the past.

There are volumes of more information on this situation. I can't know it all, and don't have time to explain everything I have learned, but its all out there, available for free on the internet from credible sources. Recommend spending some time on this.

Conclusion: The most likely way out of our abused runaway financial system is to scrap it and start over with a more stable system that will restore confidence. There will be significant volatility, loss of purchasing power held in US Dollars, and possibly hyper-inflation leading up to the reset of the current financial system. The central banks of the world that have started printing money at record levels will have to continue printing and printing until they break the system.

By the way, this was going to happen eventually. The trigger could have been a financial failure like in 2001 and 2008, or a war, or an environmental catastrophe, or any sufficiently large shock to the system. But it turned out the trigger for a collapse and a reset of the world's currency system, in my opinion, was a pandemic. The pandemic is not the cause, it's the trigger.

Wednesday, June 24, 2020

Dec Corn - Food for the Bulls Exit


Well, we're out of excuses. We have a continuation candle to the downside, we broke the lower trend line of the bull flag channel, we closed at the bottom of the candle on high volume, we're about to get a BB/KC Squeeze breakout, and stochastics are not even in oversold territory yet.

Chances favor more downside, and there's still a lot of value in the option. So we simply had no choice but to exit the position and monitor the chart for another opportunity to enter a trade.

Waited until the last minute before selling to provide the chance for a quick pull up, but it actually went even lower in the last couple minutes.

Sold the Dec 3.50 Call at 14:19:03 ET for 11 5/8 - 15 (6/1/20) = -$168.75 loss.

Tuesday, June 23, 2020

Dec Corn - Food for the Bulls Update 11


Not good. Gap down and run. No upper wick at all. Close below every Moving Average we use and near the bottom of the candle. This is all bearish and bad for our long position.

I try to leave fundamentals out of my analysis, but FYI from what I read, the major cause was a good weather forecast for this growing season. Plus last nights comments from the US Government re: China came out bearish but were corrected, but only after the Grains markets headed downward.

The "good news" is that we bounced a little off the lower Trend Lines and the Bollinger Bands and Keltner Channel. Price hasn't broken through the Bull Flag pattern, or gone lower than the low of the slow round curve we've been forming since April.

Its possible we'll form a Cup and Handle pattern, which would be bullish if we eventually break out of it.

Since we have some sources of support, and limited risk thanks to using an option, I decided to hold the position, although my rules clearly wanted to exit this trade.

Monday, June 22, 2020

Dec Corn - Food for the Bulls Update 10


Today's price action looks like bad news but maybe not. We did open with a small gap down followed by a drop straight down. No top wick on today's candle. And we closed below the 8ema. This looks bearish.

However, when combined with the previous candle, we did not form a candle sell pattern. Also, we bounced off the upward angled Trend Line and closed just above the 34ema and 20sma. But the best news is that its very typical, and even embraced by traders, when a breakout goes back and tests the resistance that price action broke through. Assuming of course, the retest reverses and continues in the same direction as the break through thereafter.

We should find out in a day or two if we're continuing up or down. Tomorrow, if we continue down, we could find support at the 50sma or the 2 lower trend lines below the 50sma. Its hard to say whether its better to close the position at that point or hold and see if the support works. We'll probably wait until the end of the trading day tomorrow and see where we close.

We could also get a doji candle tomorrow. If so, we'll have to wait until the next day to see what happens. Of course, if price goes up and closes up tomorrow, that's a no brainer.

Friday, June 19, 2020

Dec Corn - Food for the Bulls Update 9


Now we're cooking with oil! Popcorn anyone? In Update 7 I said "What we want is another breakout and a close substantially above the Bull Flag Trend Line.". That's exactly what we got today after 2 attempts failed earlier this week!

Notice the increasing volume all this week. And yet, every day, but today, resulted in a Doji candle. The battle between the Bulls and the Bears has been escalating all week but today the Bulls won. Yay for our side!

We closed above all the Moving Averages we use, except for the 200sma. We also closed above the Trend Line on high volume, as described above. These are bullish indications. I was so encouraged I almost added to the position, but being a Friday, and the fact we haven't seen confirmation yet, I refrained.

By "confirmation" I mean another bullish candle to confirm the breakout. After all , the next candle could gap down and continue down. That could also happen after a confirmation too but that would be unusual, and likely due to news.

So, thank you to the trading gods for my early Father's Day gift.

Wednesday, June 17, 2020

Dec Corn - Food for the Bulls Update 8


Today was very similar to 2 days ago. Initially price dropped down to the lower Trend Line and 20sma where it found support. It bounced off of support and rose all the way to hit the upper Trend Line exactly. Then reversed back down to close right on the 8ema, with a small body.

Today and the previous 3 trading days are all long legged Doji's on decent volume. This indicates an active but inconclusive battle between the Bulls and the Bears.

However, looking at the past several days you can see we're forming a Bull Flag pattern. I drew in the upper and lower Trend Lines to outline it. The expected conclusion to a Bull Flag is a break out to the upside. We did that yesterday, but got sucked back in like Michael Corleone.

Unless we get some significant news that effects the Corn market, I think the odds are generally in our favor for a break out to the upside.

Tuesday, June 16, 2020

Dec Corn - Food for the Bulls Update 7


We started out with a gap up, which was nice. And we broke out of the Bullish Flag through its Trend Line. This was great while it lasted. But then price went back down through the Trend Line and closed at the 8ema, which is coincident with the 3ema.

We're left like the last 2 nights, sitting on the 8ema fence. But since we did breach the Bull Flag Trend Line for a while, we kind of paved the way for more upward movement. If we had that price action while making a new high on high stochastics, I'd interpret that differently, possibly as an exhaustion candle.

So, we stay in the trade and wait another day. What we want is another breakout and a close substantially above the Bull Flag Trend Line.

Monday, June 15, 2020

Dec Corn - Food for the Bulls Update 6


Not the price action we would choose for today, but it recovered sufficiently to stay in the trade. Price initially went down but found support at the confluence of the 50sma, 20sma, and the Trend Line. Then it continued back up to close right at the 8ema.

Stochastics are still below the overbought level. And the little downward channel that formed since the 6/8/20 swing high, could be a bullish flag.

It appears we lost the momentum from the BB/KC breakout. But its not unusual to have a retest of a major resistance area after breaking out through it. You can see, looking back to 5/28/20 and forward, we rejected off the the 50sma, then broke through it, and retested it today. We may get 1 or 2 more retests, but if price action continues in a typical manner, we should continue the upward progress, and it could happen as soon as tomorrow.

Of course, anything could happen, but at the moment the best thing to do is one of the hardest things to do, which is to do nothing.

Thursday, June 11, 2020

Dec Corn - Food for the Bulls Update 5


Give thanks unto the trading gods. We had another test of the 34ema overnight, and went a little lower than the previous day. But thankfully, price reversed and closed above the 8ema and the 3ema. This is bullish.

The combination of today's candle and yesterday's candle form a Bullish Engulfing candle pattern on strong volume. This is also bullish.

At this point, stochastics have dipped down below the overbought range. So now it has more runway to run for another up leg going forward.

If you take today's range and divide by the range from the 6/8/20 high to today's low, you'll see we retraced 56% of that little down leg. That's plenty enough to consider if today was just a retracement before a continuation back down. Retracements are usually in the range of 38.2% - 61.8% which are Fibonacci ratios. And since we just formed an Evening Star pattern only 2 days ago, there's extra merit to this concern.

Wednesday, June 10, 2020

Dec Corn - Food for the Bulls Update 4


9:30am ET this morning I saw we had gapped down again and trading was below the 8ema and price was near the bottom of the candle. That looked pretty bearish. I was tempted to just do a hard exit  and capture the little profit that was left. But that wouldn't be the smartest strategy. It would be better to give Corn a chance to recover since we were still above the next moving average under the 8ema, which was the 34ema.

9:31am ET I Tweeted (@JMSTweets) "Entered a breakeven stop loss on the Dec #Corn #Futures option at 15 1/4". We purchased that option for 15 points. Added the 1/4 to cover the Bid/Ask spread and commission.

The stop loss wasn't hit and by the end of the market day (14:20 ET) price has risen a little and closed right on the 8ema. This set up still looks bearish but it lacks an actual sell signal.

So we held the position and we'll see what happens tomorrow.

Tuesday, June 9, 2020

Dec Corn - Food for the Bulls Update 3


In yesterday's post I said "the Doji could be the top of an Evening Star formation, which would require a down candle tomorrow.". Well guess what. That's what happened. We got a gap down and formed an Evening Star. And on high stochastics and solid volume. This is bad.

However, we did bounce off the 8ema and closed decidedly above it. Because of that we stayed in the trade.

The next day or two could put us in some tricky positions, where we're closing under the 8ema but getting support from one of the 4 possible sources of support I listed yesterday. Right now I'm thinking we should hold on unless we close under the bottom Trend Line. Our risk is limited to the cost of the option, and we're in a strong bullish pattern. But if we go too low, the whole pattern could be broken. On the other hand, we could just be forming a Cup & Handle pattern. It will come down to a balance between minimizing our losses and not getting out too early. We'll have to wait to see what the specifics are.

Of course, what we want is to have an up day tomorrow and close with a new high.

Monday, June 8, 2020

Dec Corn - Food for the Bulls Update 2


Dec Corn looking healthy today. Opened with a gap up, then filled the gap with a retest of the 3ema, and continued on with our upward price action, closing above the same MA's as the previous trading day. If the BB/KC Squeeze Breakout continues to work, we can expect about 3-5 more positive candles.

However, stochastics are now quite overbought and volume dropped a little. These are of some concern but not a good reason to exit.

Also, today we formed a Doji candle. This is not what we want. It indicates the bullish move has lost some conviction, but its a Monday, so we can give it a pass. However, the Doji could be the top of an Evening Star formation, which would require a down candle tomorrow. These things are also of some concern but not a good reason to exit.

When looking at the increasing separation between closing price and the 8ema, combined with high stochastics and a Doji candle, I can feel the fear talking to me "Get Out with the profit you have!", "You can always get back in.". But I'm fighting that fear and holding the position. We don't want to miss out on a gap and run tomorrow.

There is some reassurance from seeing the potential support from the 50sma, 8ema, 34ema, 20sma, and the upward Trend Lines all beneath us, just waiting to reject a pull back. And the fact we're in the middle of BB/KC Breakout. Of course, I'd rather just see a straight line up to the target, but that would be rare.

Friday, June 5, 2020

Dec Corn - Food for the Bulls Update 1


It was a great day for Corn! We got a nice strong continuation to the upside and closed near the top of the candle. And volume is higher than yesterday. This is bullish.

Look how little the bottom wick is. We opened at 342 1/4 and the low was 342. So the bottom wick is only 1/4 point. This is bullish.

If you look closely you'll see the upper Bollinger Band (thin light blue curve) crossed up and over the upper Keltner Channel boundary (thin dark blue curve) and stayed there at the close. This is a BB/KC breakout, aka Squeeze Breakout. This is usually very bullish, and leads to 5-7 more bullish candles. I've been told this is true about 70% of the time.

There is one concern. The stochastics are now overbought (>80%). That's just a yellow caution flag at the moment. But the higher stochastics goes and the longer it stays over 80%, the more pressure there is for a pull back. If you look at your daily corn chart over the past 12 months you'll see there have been many periods when stochastics were either overbought or oversold for many days. So its not a problem but eventually it may cause me to exit at the 50% Fib (365) rather than the 61.8% Fib (374).

Thursday, June 4, 2020

Dec Corn - Food for the Bulls


December Corn Futures had a strong day and closed above the 50sma as well as the 3ema, 8ema, 20ema, and 34ema. Stochastics not yet over bought. Here's what else I saw:


  • Broke through final MA resistance (50sma).
  • Higher lows.
  • Last dip couldn't close below 8ema.
  • Doji sandwich.
  • BB/KC Breakout is imminent.

This setup looks ripe for an entry. Of course, anything can happen. Preferably we'll get a small retracement to test the 50sma, then rocket upward. If we get the Bollinger Band/Keltner Channel Breakout, we can expect 5-7 more candles to the upside.

Normally, I'd pick the 50% Fib at 365 1/4 as the target. But because we're coming out of a consolidation period, and may get the BB/KC tailwind, and the down sloping 200sma should be near the 61.8% Fib by the time we reach it, let's set the initial target to the 61.8% Fib at 374 1/2. We'll actually use 374 to allow 2 ticks for the Bid/Ask spread. We can always exit at the 50% Fib if conditions warrant it.

So we got a Dec 3.50 Call for 15 points (15*50=$750 at risk).

Why did we use an option instead of the futures? One reason is this upward angled consolidation could be just a Bear Flag and we get the rug pulled out from under us. Another reason is the headline risk of China saying forget your Yankee corn, we're shopping at the Brazilian market. Also, if this consolidation is a channel, then we're close to the top of the channel.

Why did we choose the December contract instead of July? I got that idea from Larry Pesavento (you can Google him, he's famous), who said there's usually at least 1 crop scare during the growing season. If you want to catch it, then you'll want the Dec contract since it could happen after the July contract expiration. (Actually, I did get a July 3.30 Call option as well for 6 points but since I'd expect the price action should be the same as the Dec contract I didn't want to blog about it.)

July Wheat Got In My Face Exit


Target hit! Not just hit, but surgically taken out. Our target was 528. Today's high was 529. Close enough for government work :) We targeted that exit like Seal Team 6!

I think this chart can go much higher, but don't want to be a pig. This target was such an obvious level of potential resistance, its quite likely we'll get a pull back from here. If we do, we'll possibly get a better entry because its lower.

Also, we pierced the Inverted Head & Shoulders today. Its common to go back down and retest the neckline. In fact, its a better set up if we do, as opposed to just HODLing.

Notice we added the Head & Shoulders projected break out price move in light blue today. We can add it because now we know where we broke out. The projected target is about 550. But I've noticed Head & Shoulders often only make about half their measured move. That's marked with a thin light blue horizontal line at about 534 1/2. Also, near there is a downward Trend Line and the Green 50% Fib of the recent swing down, which oddly is equal to the previous swing up. The Green 50% Fib is 533.

Today's 528 target is pretty close to the 533, 534 1/2 targets. Not worth holding the position for the small incremental gain. Better to take our profits and eliminate our risk, then look for a pull back and find a bottom with a good risk/reward set up.

Sold the July 5.20 Call option for 17 points when the futures contract hit 528. We originally bought the option for 13 7/8 on 5/20/20. Hmm, nice symmetry :)

So the profits are: 17 - 13 7/8 = 3 1/8 * $50/pt = $156.25. This seems like a bit of a disappointment compared to the 6-7 point estimate in the first post in this thread. There must have been significant Implied Volatility loss as well as the Theta decay. The other side of the coin is we dramatically reduced our risk by using an option vs the futures.

If we really want to sabotage our happiness, let's calculate the profits if we had used the futures:

528-514=14*$50=$700. Ouch! Oh well, its still a win, which is always welcome.


July Soybeans Possible Breakout Exit


Target hit! Our target was 869 at the 50% Fibonacci retracement. The precise Fib number is 869 1/2 but we usually shade the target by 2 ticks to account for the Bid/Ask spread and sometimes targets are missed by just 1 or 2 ticks.

I think this chart can go a little higher or maybe even a lot higher. But we closed above the upper Bollinger Band, on high volume, and overbought Stochastics. Plus we're close to a previous swing high on 4/13/20 that we haven't approached before. And the 50% Fib is itself a typical level for a rejection. All these indications are saying don't be a pig. Remember Bulls make money, Bears make money, but Pigs get slaughtered.

So I let the target take us out and captured the profits, and thereby also removed the risk. The plan now is to wait for a pull back to hit bottom and start to reverse back up, then evaluate the situation and decide if there's a trade worth the risk.

Profits are 869 - 847 1/4 = 21 3/4 points *$50/pt = $1,087.50

Very nice win!

Wednesday, June 3, 2020

July Wheat Got In My Face Update 8


We got the desired outcome discussed yesterday. We gapped up, then came back down and tested the intersection of the 2 Trend Lines again, took an excursion to the upside, but came back down to the 8ema and 3ema and closed just a teeny little bit over them.

Today's candle is probably best described as a Doji, which represents indecision. Indecision describes the past couple/few weeks in total. The good news is we didn't make a new low and we stayed within the triangle formation.

Stochastics still not overbought.

It was an easy decision to hold the position, but not yet confident we'll break to the upside.

July Soybeans Possible Breakout Update 5


We got a nice gap and run today. Notice the bottom wick of today's candle did not fill the opening gap. It started to but not fully. This is both good news and bad news.

The good news is the bullish sentiment is so strong that price action couldn't even fill the little gap before the Bulls started piling in so hot and heavy it drove price up too hard to come back down.

The bad news is gaps tend to get filled in. So if not today, it'll most likely be some other day. If that other day is before we hit our target, it will be a set back.

We opened right on the 50sma and closed significantly above it, and above all our other Moving Averages, except for the 200sma. This is bullish.

Stochastics show we're still not overbought. Also, the Bollinger Bands (BB) are still inside the Keltner Channel (KC). If we continue up and get a candle close with the BB outside the KC that is a BB/KC breakout and usually good for 5-7 more candles in the same direction.

Things are looking good in the Soybean department.

Tuesday, June 2, 2020

TWTR Premature Bearish Entry Exit


Today opened with a gap up and closed with a Doji candle above yesterday's close, 8ema, and 3ema. Even though the past 2 days don't form a candle sell pattern, which increases the odds we'll turn around soon, this price action is not consistent with our thesis.

The Doji represents indecision, and it could gap down and run tomorrow, but it could also continue up. As usual the news/fundamentals are completely unreliable for swing trading. However, we had technical chart based reasons to short this, so its not regrettable.

Having no edge makes it a simple gamble, and that's not our objective. We only want to enter and stay in trades where the chart indications favor our thesis. We have no reason to think we'll prosper from simple gambling.

So, we sold the TWTR Sep 30 Put for $2.55. We bought it for 3.15 so we lost $60. If things went our way and we hit our target we would have made 10 times that. So while it was a losing trade, it was still a good trade.

July Soybeans Possible Breakout Update 4


July Beans gave us a nice big bullish engulfing pattern. Yesterday's close was 840 1/2 and today's open was 840. So, no question about the pattern. It also closed over the 3ema, 8ema, 20sma, and 34ema. We also pierced the 50sma but closed below it. We did close over the 34ema and we haven't done that since March 31st, 2 months ago. And all this was on significant volume.

These are bullish indications, so we gladly held the position.

July Wheat Got In My Face Update 7


This was a very difficult decision! The 2 candles before today rejected off the Inverted Head & Shoulders neckline and formed a bearish Harami pattern. Now today's candle confirmed the sell signal and closed below the 8ema. Rules say exit the long position and look for an opportunity to go short. The position ended the day down about $300 but that's only half the possible loss. If it wasn't for some mitigating factors I definitely would have sold the option. If you've been following this blog you've seen me do it many times and I would definitely do it again.

However, notice today's sharp price move stopped right on the intersection of 2 Trend Lines. One is angled downward and the other started 5/18/20 and is angled upward. This demonstrates support right at today's low and preserved the Triangle pattern.

Also, notice the price action since 5/18/20 has been snaking around the 8ema. Some candles close above and some close below. We're forming a triangle pattern and we're getting very close to the breakout point. Unfortunately, at this point we don't know which way we'll break. But we do have all the original bullish reasons we entered this trade in the first place, which suggests we'll break to the upside.

Do you risk angering the trading gods by ignoring our rules yet once again, or do you recognize, given the current specific situation, there's a reasonable chance we're still just respecting the neckline, and now that we hit support, we'll bounce back up before the end of the day tomorrow?

Another consideration, in my opinion, is that once we've broken out of this triangle consolidation we should have a big move in that direction, possibly after a retest of the triangle trend lines. If so, the big move should more than make up for a loss, if we break to the downside.

So, risking the wrath of you know who, I decided to make another exception to the rules, and hold the position.

P.S. The reason I can break the rules is because I understand why they were made, since I'm the one who made them. That's not to say its ok to break the rules because you're the one who made them, I'm saying because you understand the assumptions behind the rules, and the trading situations that gave rise to the rules, you're in a position to recognize when they should be given less weight than usual.

Monday, June 1, 2020

July Soybeans Possible Breakout Update 3


Today we got a very symmetrical looking Doji Candle. The low bounced off the Trend Line, and the top bounced off the 34ema. Volume shows a very active battle between the Bears and the Bulls. We closed so close to the 8ema that its very reasonable to regard this as simple bobbling around within the consolidation area.

I don't think an exit is warranted by today's price action given the situation price is in.

P.S. I try to keep fundamentals out of the picture, but China has made threatening comments today that are bearish for Soybeans. But we closed with a Doji pattern anyway, which means indecision, not bearishness. This adds confidence to holding the position. But after years of trading and seeing what I've seen, I value what I see on the chart far more than what's in the news.

July Wheat Got In My Face Update 6


We bounced off the Inverse Head & Shoulders Neckline today. And in so doing we formed a Bearish Harami candle pattern when combined with the previous candle. These are bearish indications, counter to our long position.

However,  respecting the neckline gives it legitimacy. This is good news, because even if we have to bail out on this as a long trade, a continuing rejection off a bullish pattern often gives you a nice big move in the opposite direction. As a trader, I don't care if Wheat shoots up or plows down, as long as we get a nice big move.

You can see from the shape of today's candle, we started downward, and went below the 8ema. But then we rejected off a Trend Line and the 20sma.

By the end of the trading day, we closed above the 8ema and even above the 3ema. Volume shows we had a pretty decent battle between the bears and the bulls. Stochastics is still in the middle range, which means we have room to the upside before we're overbought.

So, weighing all this out, and considering we have defined limited risk, thanks to using an option rather than the futures on this particular trade, I decided to stay in the trade.

TWTR Premature Bearish Entry Update 1


We bounced off the Trend Line and closed over the 8ema. Technically we should exit here and wait for another bearish indication to get back in this short trade.

However, today's candle combined with the previous candle does not form a sell pattern. And today's volume is small compared to the past 3 candles, which were all bearish. Plus, its natural to bounce around a bit within this consolidation triangle pattern. And price action on Monday's is a little suspect anyway.

So, I'm going to bend the rules a bit and stay in this trade for now.