Showing posts with label Fibonacci. Show all posts

Thursday, January 12, 2023

XLE Re-entry - Update 1

XLE Daily


Looking good today! After bobbling between the downward Trend Line and the 50 SMA for a few days, we gapped up at the Open above the 50 SMA and stayed above it all day. We had decent volume, decent size green candle, and looks like we got a Bollinger Band/Keltner Channel squeeze breakout to the upside. We closed above all Moving Averages and closer to the top of the candle than the bottom. All this is bullish.

Unfortunately, we also entered a previous congestion area to the left, and Stochastics are now in the overbought area. We closed a little stretched above the 3 ema and 8 ema. These provide bearish pressures. It would be reasonable to have a pull back and retest the downward Trend Line.

Strangely, while our energy ETF is looking bullish, the Feb. crude oil futures has a bearish setup. I tweeted 15:47 ET today "Oil Futures Mar 4hr showing tweezer top near 78.6% Fib and a Gartley D point.". Initially, this seems like a contradiction, but we're dealing with apples and oranges. The XLE is an ETF constructed by equities, and the CL futures is the actual crude oil commodity itself. So, its perfectly reasonable that these two will sometimes diverge.

CL Mar Oil Futures 4hr Chart


I decided to hold the XLE long position since it appears the bullish indications beat the bearish ones, and we have now resumed the general upward trend.

(We also shorted the March oil futures, but that's a different trade.)

Wednesday, December 21, 2022

XLE Looks Positive

XLE Daily


The applicable part of this Daily chart, regarding this trade, begins at the 65.48 low on 7/14/22. If you draw Fibonacci levels from the recent 94.71 swing high on 11/14/22 down to the 65.48 low on 7/14/22, you'll see the current swing low at 82.65 on 12/9/22 is very close to the 38.2% Fib retracement.

Notice the price action from 94.71 to 82.65 is in a AB/CD format. See the 2 little white, downward angled, diagonal lines. And, the 82.88 swing low 2 days ago made a higher low than the 82.65 low.

Also, Stochastics, on the bottom of the chart, are extremely low at the 82.65 low.

A setup like this can lead to a substantial bounce up to the -27.2% Fib extension at 102.64. It would have been better for me to wait until the Close today to see if we close over the 8ema. Its mid-day and we are over the 8ema but I should wait a few more hours. But I'm going to be busy with other trades I have planned near the close, so I'm going to jump the gun, but use options to limit my risk to a defined amount, which is the cost of the options.

So, I got an XLE March 95 Call for 2.22. I picked March to allow enough time for the trade but also to control the Theta time decay. Also, this option has a 30% Delta, which is an inflection point in the Delta vs underlying curve, meaning Delta accelerates its increase from 30% to 70%.

The Target is the -27.2% Fib extension at 102.64. This also coincides with the price swing from 7/14/22 to 8/29/22, as represented by the thick, white, upward angled, line. The next price swing is longer, which doesn't hurt. 

I almost always shade my entries, stops, and targets to account for slippage and bid/ask spreads. So, my actual exit is when XLE is 102.50.


Wednesday, December 7, 2022

Bullish Jan 2023 Beans - Exit

Jan Soybeans Daily at 13:30 ET


Jan Soybeans 5 minute at 13:30 ET


We have a big grains related report due out this Friday 12/9/22, which means its more likely we'll continue in a sideways consolidation until the report than have a consolidation break out. We're at the 78.6% Fibonacci level as well as previous resistance.

Considering price was over the upper Bollinger Band after a good acceleration on the Daily chart, the 5 minute chart is starting to roll over, and we had a 24% gain in our position, I decided it would be best if I sell now (13:30 ET).

I sent a Tweet at 13:41 ET announcing I sold, which gave anyone following me 40 minutes to take action if they wanted to.

Summary: I exited today even though we haven't reached our target because I think we'll go down to sideways until the report on Friday, with no clue what will happen in response to the report.

Bought: Jan 1450/1460 Call Spread for 5 1/8 on 11/29/22 (5.125 * $50 = $256.25)
Sold today 13:30 ET for 6 3/8
Profit 6 3/8 - 5 1/8 = 1.25 * $50 = $62.50 (62.50/256.25 = 24% gain) 

Thursday, November 10, 2022

Amazon Bullish Kicker


I should wait until the end of the day to enter this trade, but the market momentum for today is very strong. So it seems very unlikely the technical setup will not be in pace at the Close. The market gapped up today on the CPI inflation report that indicates inflation is easing. I think this sentiment is premature, but I think it'll last long enough to hit our Target.

AMZN is showing the following on the Daily chart above:

  • Kicker candlestick pattern
  • Bounce off the 127.2% Fibonacci level
  • Low stochastics
  • Likely Close above the 8ema
The Target is the top of the 109.77 - 104.87 gap. Bought AMZN Nov 100/105 Call Vertical option spread for 1.18 at 12pm ET today. The close proximity of the 11/18/22 expiration date will help with the "fuller" valuation of the spread than a later dated expiration. The spread will help mitigate the high Theta time decay.

Monday, July 18, 2022

Energy May Be Turning On

XLE Daily


XLE looked bullish enough this morning to go long. Got a XLE Sep 75 Call for 3.05.

Here's what I see:

  • Bounce off the 61.8% Fibonacci level
  • Bounce off Support/Resistance level around 65.50
  • Positive Stochastics Divergence
  • Bounce off 200sma
  • Trend Line Breakout
  • Close over the 8ema
Set the Target to the 50sma at about 78.50. This will need adjustment as the 50sma is slowly descending.

Set the Stop to just under the 65.48 swing low at 65.36.

I'll look at the risk/reward in terms of the stock rather than the complicated theoretical estimate of the option:

Risk: 70.36 - 65.36 = 5.00
Reward: 78.50 - 70.36 = 8.14
R:R = 8.14/5 = 1.628:1 Not very good but its a rough estimate and fixed maximum loss.


Wednesday, June 22, 2022

JNJ No Tears Gartley Pattern - Update 1

JNJ Daily


Great day for our JNJ trade. Got a big candle on big volume with a Close above the 20sma. We bounced off the 50sma, which is a concern, but we've breached it many times before.

We made a higher high and a higher low. The ADX made a bullish cross. Stochastics are still in the mid-range, so no selling pressure from that.

We hit the .5AD level, which is constructive, and we closed in the upper half of today's candle.

The Aug 175 Call option, for which we paid 3.52, had a high today of 7.60. That's better than a double. The voice in my head was quite disappointed when I didn't succumb and sell the option to capture the profits. Especially since I've had trades where I exercised discipline and held out for the target, but the chart reversed the next day and I ended up with much less profit, or worse.

But it looks like we only need one more green candle and we'll hit our 179 target. Plus everything looks bullish for this trade. 

So, bottom line, I held the line and held our position for another 3 points. Looking at the option chain, it looks like between today's stock close 175.74 and our Target 179, we'll get an average Delta of about 60. So, if we hit the Target, the additional profit would be approximately 3.25 * 60% * 100 = $195. 

Seems like holding the position is the smarter trade, albeit the more uncomfortable one.


Tuesday, June 21, 2022

JNJ No Tears Gartley Pattern

JNJ 6/21/22 Daily Chart


Went long with a JNJ Aug 175 Call on 6/14/2022 for $3.52. At the time, the stock was 168. I entered due to the confluence of the AB/CD, 200sma, and 61.8% Fibonacci retracement. But I got in early, without confirmation. We got that confirmation today, with a close above the 8ema.

Here's what I saw today:

  • Bounced off 61.8% Fibonacci of the Gartley pattern
  • Bounced off 200sma
  • Bounced off AB=CD of the Gartley pattern
  • Oversold Stochastics
  • ADX Quit the Down Trend
  • Trend Kicker candlestick signal
  • Close over 8ema
Set the Stop to 167, just below the D point.
Set the Target to 179, just below the .618AD level of the Gartley pattern.

Maximum Risk is the full cost of the Call option, $352. But a better gauge for comparison to other trades is to use the stock value:

Risk = 168 - 167 = $1.
Reward = 179 - 168 = $11.
R:R = 11/1 = 11:1 which is ridiculously great. To be fair, the initial risk wasn't the current Stop. The initial Risk was 168 - 155 = 13, which would represent a bad R:R. 

Let's look at the R:R if I got the 175 Call option at the end of today, but based on stock price. Today's close for JNJ was 173.01:

Risk = 173 - 167 = 6
Reward = 179 - 173 = 6
R:R = 1:1 on this basis, which is considered too low. However, this trade is based on the Gartley pattern, which has a Win Rate of 75%. So, given the Win Rate, 1:1 is acceptable.


Monday, June 13, 2022

ZIM Zooming Down - Update 3

ZIM Daily 6/13/2022


Today we opened gap down then retraced to fill in most of the gap. But today's price action was so bearish, we headed back down before we could fill the full gap.

We ended the day with a Doji candle but near the bottom of the range. Today's low was 47.68. The previous swing low (our B point in the AB=CD) was 48.21, which means we confirmed the AB=CD pattern by surpassing the B point. This is encouraging for our trade.

But, take a look at the Stochastics panel on the bottom of the chart. It is definitely oversold now (under 20). This is a concern as it provides a kind of pressure to reverse the price action. When Stochastics are oversold, I start looking for the next likely support level. I see it as the 61.8% Fibonacci level, which also coincides with a previous swing low on 10/6/21 at 42.14. The 61.8% Fib can be calculated as:

A-.618(A-X) = 91.23-.618(91.23-11.34) = 41.86

So, I changed the target for the new July 40 Put option to 42.50, which shades the previous swing low of 42.14 to account for slippage, Bid/Ask spread, and premature buying pressure.

Given the strong momentum of the current down leg, characterized by gaps and relatively long candles, I'd expect we'll ultimately get down near our original target at 29. However, it seems likely we'll get a bounce before then. I'd rather exit and re-enter later than ride out the bounce.

Also, there is a potentially big market moving event this Wed. 6/14/22 at 14:00 ET. The FOMC rate decision. It would be great to capture profits and be out of the market before then. That's a supporting reason to raise our target.

Friday, June 10, 2022

ZIM Zooming Down - Update 2

ZIM 6/10/22 Daily Chart


Yesterday's post included "it seems very likely we'll get a higher than expected inflation number. If we do, then that puts more pressure on the Federal Reserve to increase short term interest rates higher and faster. That should be very bearish for the market.". That's exactly what happened. I didn't watch our Put value continuously, but I did notice our profit got as high as $350. It may have been even higher.

Soon as the CPI Report came out at 8:30am ET this morning and the equity futures started tanking, I knew we didn't need our June 60 Call hedge anymore, but the option market didn't open until 9:30. So I entered a limit order to sell the option for at least $10. At 8:56am ET I sent this Tweet:

"CPI report was worse inflation than expected, as we predicted. ZIM should drop more. Entered order to sell the hedge for at least .10"

When the market opened at 9:30 our June 60 Call sold for .48, so we only lost .60 - .48 = .12 x 100 shares = -$12. Cheap insurance to protect our $590 position.

Near the Close, I had to make a decision. The voice in my head was insisting I sell and capture the profits while I can. I don't want to hold over the weekend and wake up Monday to a loss because ZIM announced they're being acquired (just made that up), or some other bullish news. What to do?

Today we formed a Doji candle below yesterday's low but near it. If, on Monday, we gap up a little at the Open and make a significant green candle, then we'd form a 3 candle pattern called a Morning Star. And since Stochastics are now oversold, this pattern would be very bullish. And volume has diminished. 

Also, we're sitting right on the 50% Fibonacci level. It would be normal for this level to provide support. However, if you look left, you'll see we already bounced off the 50% Fib on 4/25/22. Price could certainly bounce again, but often once you've paid your respects to a support level you don't need to pay tribute again.

All of the points above give credence to the greedy, paranoid voice in my head saying "sell, sell, sell!". However, this is still a bearish setup in a bear market. Chances are we will continue down on Monday. But maybe it would be a good idea to take something off the table. I thought about a good way to do that and came up with this: Roll down the option. Here's how I did that:

I sold our July 55 Put for 5.90. This captured 5.90 - 3.20 = 2.70 x 100 shares = $270 in profit.
Then I bought a July 40 Put for .98 x 100 shares = $98.00. If we lose that whole option, then we'll still have $270 - 98 = $172 in profits. So we "rolled down" the option strikes in our position from 55 to 40, and thereby captured some good profit but stayed short to benefit from any further drop in the ZIM stock price.

Our current balance is $270 - 12 = $258 in hard money profit. Plus we have a July 40 Put worth $98.

Wednesday, June 8, 2022

ZIM Zooming Down

ZIM Daily


Shorted stock ZIM this afternoon by buying a July 55 Put for $3.20. Quarterly Earnings is 8/17/22 before the market opens. I Tweeted this out at 15:39 ET.

Here's why I'm bearish:

  • Kicker candlestick pattern
  • Blue ice failure
  • Negative Stochastics Divergence
  • Close below 8ema,200sma
  • High volume, Big bar
  • AB/CD
A Kicker pattern is when you have 2 candles separated by a gap and facing different directions (Up and Down).

Blue Ice Failure I learned from Steven Bigalow in candlestickforum.com. Its when price comes up from below the 50sma, breaks through it but can't hold it, and falls back through the 50sma. Steve uses blue for his 50sma while I use red. That's why he calls it Blue Ice Failure.

To see the NSD, look at the downward angled thick, white, line segment in the Stochastics panel at the bottom of the chart. Then see the upward thick, white, line segment on the price chart directly above. Price was heading up while Stochastics was heading down in the same time period. That's Negative Stochastics Divergence and a bearish indication.

The AB/CD pattern has not been confirmed yet because it hasn't closed below the B point at 48.21. So I did get in early but I figured it was a reasonable decision thanks to all the other bearish indications. The measured move for where to expect price to go is the D point where AB=CD, which can be calculated by D=C-(A-B)=71.40-(91.23-48.21)=28.38.

The calculated D point coincides with the 78.6% retracement at A-.786XA=91.23-.786(91.23-11.34)=28.44. So this area makes a good target.

Also, if we get to the target, then we will have set up a Gartley pattern. So the Target is a great place to reverse our position.

Summary:

Entered 6/8/2022 15:13 ET, ZIM=58.91, Bought July 55 Put for $3.20
Target 29 (which is shaded a little to account for slippage, bid/ask spread, and an early completion)
Stop is just above the Kicker at ZIM=70

Using the stock to calculate the risk:reward ratio:

Risk = 58.91 - 70 = -11.09
Reward = 58.91 - 29 = 29.91
R:R = 29.91/11.09 = 2.70 which is great.

Monday, May 23, 2022

July Corn Possibly About To Pop - Update 7

July Corn Daily


We're still in the Gap, above the 38.2% Fibonacci level, and made a nice green candlestick, closing near the highs. This is somewhat bullish. 

However, we didn't close above the 8ema. In fact, we barely pierced it at all. This isn't very bullish. But we survived the weekend, and the trade still looks viable. 

Its reasonable to interpret this chart to imply we came down to this area to fill in the Gap. We did that. Now we're setting up to resume our upward trajectory.

This trade is going to continue to feel unconvincing until we close above the previous swing high, which was 810 1/4. If you look at the sequential swing highs and lows, you'll see we're forming a sideways wedge (or triangle). See the thin, white, angled lines.


Thursday, May 19, 2022

July Corn Possibly About To Pop - Update 5

July Corn Daily


Not much to say other than we seem to be getting support from the 38.2% Finonacci level as well as the bottom of the gap. Technically, I should have exited the position today because:

  • We made a lower low and lower high today
  • We closed below the 8ema
  • We made a Doji candle, which is indecisive
  • We made a lower swing high 3 trading days ago

But sometimes its ok to use some human judgement. I think its very likely we came down to fill in the gap, and now we can bottom out and start back up.

So, I want to rely on our Stop and give the trade some slack. If this was a mistake, and I should have gotten out today, then price will continue further down tomorrow and likely hit our Stop. My expectation is we head back up tomorrow.

Thursday, May 12, 2022

July Corn Possibly About To Pop

July Corn Daily

July Wheat Daily

Today, 5/12/2022 at 12:00 pm ET, several grain related reports were released by the USDA. Wheat rocketed up, and this is the grain I wanted to buy, but the risk is too high for a pullback to the support level it broke through. So, I may get some wheat if it pulls back then bounces back up.

The corn market had a much more subdued reaction, yet still bullish. You can see yesterday and the day before formed a Doji Gap Up candlestick pattern, after bouncing off the 38.2% Fibonacci retracement level.You can also see Stochastics were oversold at the swing bottom. Finally, we closed over the 8ema and every other MA on my chart, on high volume.

I don't go out of my way to follow fundamentals, but the price of everything is going up in our high inflationary environment, which especially includes food and energy. Corn is used for both. This is generally bullish for corn. Then you have decreased grain exports from major supplier countries and bottlenecks in the supply chain. Also bullish for corn.

Also, the US Dollar has been screaming higher due to a flight to safety to the USD. A strong dollar should diminish prices, but corn rose today as the dollar ETF UUP made a new 2 year high.

So, based on all this bullishness, very near the market close at 14:20 ET, we bought a YC July futures contract for 794 1/2. I managed to get a Tweet out at 14:14 ET. Set a Stop at 768, just below the recent swing low, and a Target at 860, shading the 127.2% Fibonacci extension of 860.382 by just a little. We're using the YC mini-contract ($10/pt) rather than the full sized contract ($50/pt) to contain risk.

Summary:

Entry 794 1/2
Stop 768
Target 860

Risk 794 1/2 - 768 = 26 1/2 points
Reward 860 - 794 1/2 = 65 1/2 points
R:R = 65.5/26.5 = 2.5:1 which is great.

Thursday, March 24, 2022

NVDA Chips are Up


The Daily chart above on NVDA shows a Bullish setup:

  • Double/Triple Bottom
  • AB/CD pattern confirmed by price exceeding the B point, and on high volume.
    • The C point is only a 25.2% retracement. That's Bullish.
  • Today and yesterday form a Trend Kicker candlestick pattern.
For a Target, take a look at the following:

The vertical, thick, white line segments show a measured move of the double bottom.

The diagonal, thick, white line segments show the AB=CD measured move.

The 161.8% Fibonacci extension of the green range is approximately 308. This is between the 61.8% and 78.6% Fibs of the yellow range.

Previous swing high was 313.30.

I like a conservative Target of 308.

Near the equity market close today I got an April 14th 290/295 Call Option Spread for $1.71. A spread will greatly reduce the capital at risk, limit the maximum risk to the cost of the spread, and help mitigate the Theta time decay of the long option in the spread.

I entered 2 sell orders. One is a $4.90 limit order for the spread, since it has a maximum value of 295-290=$5.00. The other is to sell the spread with a limit order at the mid-point between the Bid and Ask if NVDA stock price hits 308.

Risk: $171
Reward: It depends how long it takes to hit the Target, but the maximum reward would be $490.
R:R = 490/171 = 1:2.9 which is great.

Friday, March 11, 2022

June AUD/USD Russian Doll Gartley Patterns - Update 1

1 Hr Chart

15 Minute Chart


You can see on the 1 hour and 15 minute charts above, in the purple, that a 3rd Gartley pattern developed over night last night. I tried trading it but after the D point, price only got up to .73425, which is less than even the .5AD level. Then it meandered downward and broke the X point.

I admit it was weird trading a Bullish pattern when the other bigger patterns were Bearish. But you can see a nice up leg when the C point formed. So it was very reasonable to anticipate we could hit the .618AD of the purple range. 

And, I have learned that when you have a methodology with a proven edge, then you must take every set up, because you never know which individual trade will fail. The Gartley has a proven win rate of about 75%. So, even though this 3rd pattern was in the opposite direction of the core trade, I had to take it.

Now for the good news. The Target for the yellow range was .7304, as described in the previous post. We hit that at exactly 15:00 ET. So the first of the 2 planned trades has completed, and we have the other one still working.

Since the 3rd pattern that developed overnight, and failed, was not a planned aspect of this trade, I'm going to leave out the P&L from that separate trade.

The profit from the 1st half of the trade is:

.7372 - .7304 = 68 pips * $1.00/pip = $68. If we used the full sized contract, it would have been $680.


Thursday, March 10, 2022

June AUD/USD Russian Doll Gartley Patterns


This is going to be a crazy trade. I was setting up the Gartley pattern on the AUD/USD 60 minute chart above and when I was finished, I noticed there's another smaller Gartley pattern inside the first.

The bigger Gartley, let's call it the 1 hour (1h) Gartley, is still establishing its C point. I was going to wait for the D point before entering a trade. But the smaller Gartley, let's call it the 15 minute (15m) Gartley, is establishing its D point. 

The 1h Gartley has white comments and green Fibonacci's. The 15m Gartley has yellow comments and yellow Fibonacci's.

So, we can enter the 15m Gartley, but instead of using the usual .618AD Target, we can go for a bigger Target of the 1h Gartley D point. However, I want to be conservative and trade each pattern separately.

I got 2 AUD June futures using mini-contracts because the risk is 85 pips. If I used 2 full contracts I'd be risking $1,700.

I bought the 2 futures at .7372. The Stop for both is just over the X,A point at .7457. The first Target is the .618AD of the 15m Gartley. Using the current D value of .73775, the Target is:

.73775-.618(.73775-.72555)=0.7302104

The second Target is the 78.6% Fibonacci of the 1h Gartley XA leg, which is .71797. Also, using the current C point, the calculated D point is:

.73775-(.7455-.72555)=.7178, which is amazingly close to the .71797 Fib.

We'll shade the second Target a bit because on the way there, we'll encounter the .7200 level, which is a round number. You might point out we'll also be encountering the .7300 level, but that's nowhere close to the Target. Also, there is some possible support from a gap down and swing low from late February. This adds to desire to shade the second Target up to the .7200 level.

Now, here's more craziness. There's a speaking engagement in Australia by RBA Govenor Lowe at 17:15 ET, while the FX market is closed between 17:00 - 18:00. So, come 18:00 this evening, we may get a gap open but there's no telling in which direction. I could have waited until after 18:00 to enter, but I decided I can handle the risk.

Bottom Line:

Trade 1

Enter: .7372
Stop: .7457
Target: .7304
Risk: .7372 -. 7457 = -85 pips.
Reward: .7372 - .7304 = 68 pips.
R:R : 68/85 = 1:0.8 This looks bad but remember the Gartley pattern has a 75% Win Rate, which means you could have a R:R of 1:0.3 and still break even. Plus we have the 1h Gartley that may pull down price further than usual.

Trade 2

Enter: .7372
Stop: .7457
Target: .7201
Risk: .7372 - .7304 = 68 pips.
Reward: .7372 - .7201 = 171 pips.
R:R = 171/68 = 1:2.5 which is great.

Wednesday, March 9, 2022

Live Cattle Megaphone - Exit

3/4/2022 15 minute 10:52 ET


On March 4th at 10:59am ET I sent this Tweet with the 15 minute chart above:

"Sold our long April Live Cattle Futures position for a small profit. Price dropped to far at the open. Sold it on the bounce. Details later."

The ideal low point would have been the 127.2% Fibonacci extension at 136.405. But price shot right through there and came close to the 161.8% extension. Then retraced upward but bounced off the 8ema and headed back down.

This didn't look like it was honoring the megaphone pattern at all. Thus our thesis was violated and we had no reason to stay in the trade.

The original buy order described in the previous post was filled at  9:30:13 ET for 1.050. I sold it for 1.125 on the bounce at 10:52:40. So, the net was:

1.125 - 1.050 = .075 * $400/pt = +$30.00

At today's close on 3/9/2022 the Daily chart looks like this:

3/9/2022 Daily Close


That is still not right for a megaphone trade.

Thursday, March 3, 2022

Live Cattle Megaphone


Above is a Daily chart of April Live Cattle futures (Symbol LE). Not much on there pertains to this trade. Just look at the purple Fibonacci range and the 2 angled, straight, thin, white, lines that form a megaphone pattern.

A pattern I learned on DayTradingRadio.com years ago is to buy when price hits a Trend Line when Stochastics are extremely oversold. But you have to allow for some heat if price initially overshoots the Trend Line before reversing. Of course, price can continue down rather than reversing, so you need to control your risk with a Stop or by other means.

You can see on the chart above a beautiful megaphone pattern. Price just gently touched it right at the end of the day. On the bottom of the chart you can see Stochastics are extremely oversold. This is where you're supposed to enter a long trade. Its scary as @#$%^! Especially when you're trading a relatively illiquid commodity with a $400 point value, and no mini-sized contracts.

Also, notice we just went through the 200sma. This could add some pressure for price to reverse.

Fortunately, Live Cattle futures has options which can be used to limit your maximum risk to the cost of the option. Unfortunately, I didn't see this setup until 5 minutes before the 14:05 ET close. There wasn't enough time to get a Call option and enter long.

So, I want to enter tomorrow morning when the market opens at 9:30am ET, but not if price gaps down too far. How far is too far? I figure the 127.2% Fibonacci of the purple range is a reasonable support level. If it goes much beyond that, it's probably heading down to the 161.8% Fib or lower.

If this trade works, my expectation is for price to reverse and go back up to the top of the megaphone, or close to it.

Here's the order I entered after the Live Cattle market closed:


I entered a Buy Limit order to buy an April 142 Call with a limit of 1.3 points (1.3 pts * $400/pt = $520). The last option sold today was 1.2 points. Notice the Open Interest for the 142 Call. Its the largest of the Strikes being displayed. This suggests good liquidity when we buy or sell. It also suggests a lot of interest at that Strike price. I like both of those.

To avoid a large gap down open tomorrow that's too large, I added a condition that the futures price is greater than or equal to 135. I also made it a Day trade rather than a Good-Til-Cancel trade since tomorrow is a Friday and we're in the middle of historical geopolitical events. I may not want to enter this trade by Monday morning.


Thursday, February 24, 2022

Hogs Turned Tail


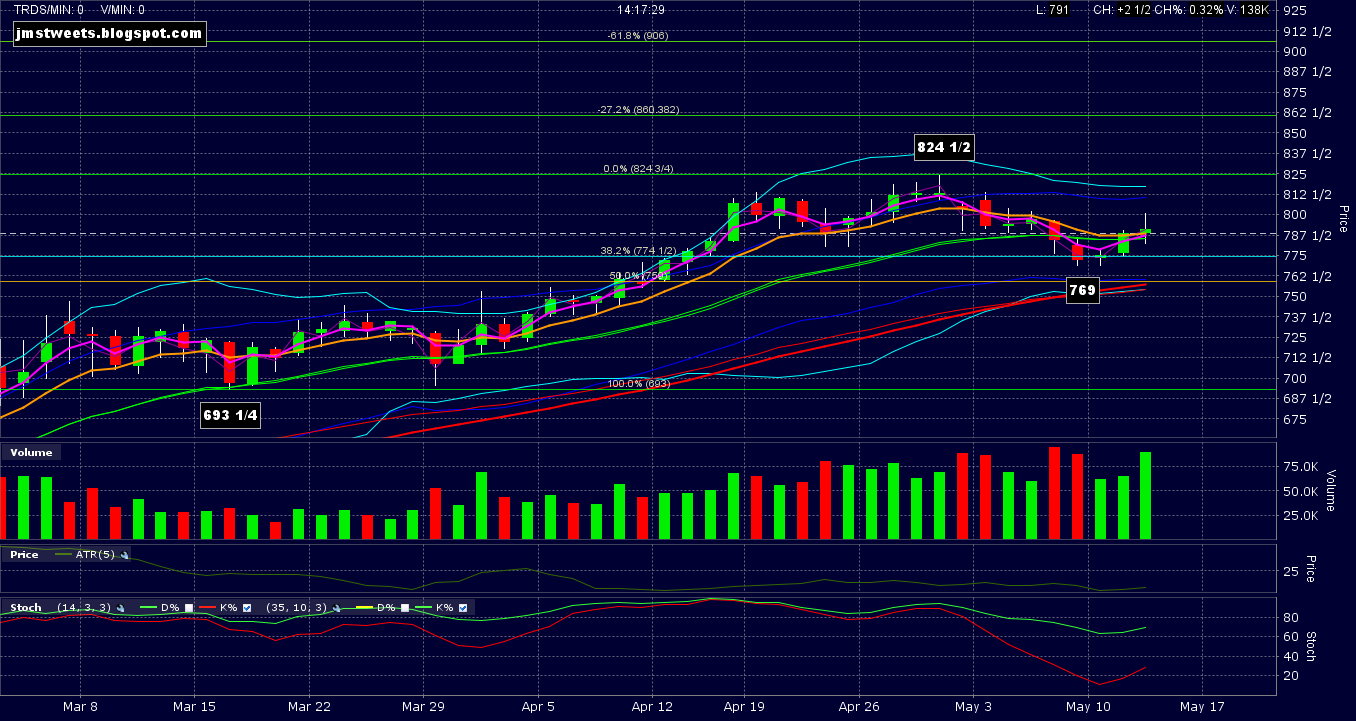
Looking at the April Lean Hogs futures daily chart above, I see some Bearish indications. We should wait until we get continuation to the down side tomorrow, but I will be too busy at the Open tomorrow to be as effective as I can be today when I have time to make a considered move. So, I decided to get in short early even though I recognize this could hurt if it goes the other way.

Here are the Bearish indications I see:

  • 3 Drives to a top.
  • Bearish Engulfing candlestick pattern.
  • Close below the 8ema. 1st candle to do so since the drive began.
  • Close near candle bottom on today's and yesterday's candles.
  • High Overbought Stochastics.
  • High Volume, indicating enthusiasm.
For the Target, you could make an argument the 38.2% Fibonacci retracement would be a good place. It coincides with a Support and Resistance level. We may in fact exit at this level but judging from the Stochastics and the enthusiasm, it looks more likely we'll make it down to the 50% Fib, which also coincides with a Support and Resistance level. I drew 2 thin, white, horizontal lines to mark this S/R level. The 50% Fib is at 98.225.

So, we'll target the 50% Fib but retain the option to get out at the 38.2% Fib if conditions suggest that is a better idea when price reaches it.

Speaking of options, we entered our short position by buying an April 104 Put for 4.4250 points. The Lean Hogs market has no mini contracts and its a relatively thinly traded market that's only opened 9:30am ET to 14:05 ET. With a point value of $400/pt, we need to control our risk somehow, and Options are the only way.

The April 104 Put option cost 4.425 * $400/pt = $1,770. The underlying HE price was 105.550 at the time we bought the option. It had a Delta of 43%.

The best Stop would be just over the recent swing high at 112.850, but that's a little too much money to lose if we hit it. For example, let's say we use a Stop of 113. The loss would be approximately:

113 - 105.55 = 7.45 Points * 43% Delta = 3.2035 * $400/pt = $1,281.40.

So, instead, we're using a Stop that's just over the high of today's candle at 110. It could certainly be hit by a reasonable retrace tomorrow. A 50% retracement of today's Close (105.4) to the swing high at 112.85, would be (112.85+105.4)/2=109.125. A 61.8% retracement would be 105.4+.618(112.85-105.4)=110.0041. We used 110.500 as a Stop, which is over the 50% and 61.8% retracements, but not by much.

Our dollar risk amount is approximately:

110.50 - 105.55 = 4.95 Points * 43% Delta = 2.1285 * $400/pt = $851.40.

I say approximately because the Delta will change as price moves. If price moves against us, then the Delta should decrease a little. Which would be more than welcome. You can use the option Gamma to estimate the Delta when the underlying hits 110.50, but its not worth it in this case.

Summary:

Bought HE Apr 104 Put for 4.4250 points, when HE was 105.550.
Stop when HE is 110.50.
Target when HE is 98.325, which shades our expected target of 98.225 by .100 points for slippage.
.100 points is .1/.025 = 4 ticks in the future and .1/.0125 = 8 ticks in the option.

Risk: $851.40 from calculation above
Reward: 105.55 - 98.325 = 7.225 Points * 43% Delta = 3.10675 * $400/pt = $1,242.70
R:R = 1242.70/851.40 = 1:1.5 not a great ratio but given the uber Bearish investor environment, thanks to Russia's invasion into the Ukraine, plus the Bearish indications discussed above, I think its adequate to take the trade.


Wednesday, February 2, 2022

March Bear Corn


Wide Daily View

Narrow Daily View


Entered a short on March Corn Futures from 622 1/4, using a YC mini contract at $10/point, right at the market Close today. ZC is the full sized contract at $50/pt.

The Daily charts above are very busy. Please focus on the light blue annotations. Here are the bearish indications I see:

  • 3 Drive to a Top
  • Completed AB=CD (see the 2 longest, thick, white, angled, line segments)
  • Bounce off Previous High (see the wide view chart)
  • Bearish Harami candlestick pattern
  • Bearish Engulfing candlestick pattern
  • Close below 8ema
  • Large candle with Large volume
  • Negative Stochastics Divergence
  • High Stochastics
  • Bounce off Lt Blue 161.8% Fibonacci extension

Selecting the Target at the top of previous congestion, which is coincident with the 50 sma (thick red wavy line). This at about 600.

I set the Stop at 643, just above the recent swing high of 642 1/2.

I think its likely we'll get a bigger pullback but I want to be out of this trade before the big USDA reports on 2/9/22 at 12:00pm ET. Sometimes you see this list abbreviated, or nicknamed, the WASDE Report. Here's the list of reports due out at 12:00


So, in addition to a Stop and a Target, I also entered a conditional order to close out this trade at 11:45am ET on Wednesday 2/9/2022.

Summary:

Entry 622 1/4
Stop 643
Target 602

Risk = 622.25 - 643 = -20.75
Reward = 622.25 - 602 = 20.25
R:R = 1:1 which is worse than the recommended minimum 1:2 ratio but this looks like a high probability trade.