Showing posts with label Futures. Show all posts

Thursday, January 12, 2023

XLE Re-entry - Update 1

XLE Daily


Looking good today! After bobbling between the downward Trend Line and the 50 SMA for a few days, we gapped up at the Open above the 50 SMA and stayed above it all day. We had decent volume, decent size green candle, and looks like we got a Bollinger Band/Keltner Channel squeeze breakout to the upside. We closed above all Moving Averages and closer to the top of the candle than the bottom. All this is bullish.

Unfortunately, we also entered a previous congestion area to the left, and Stochastics are now in the overbought area. We closed a little stretched above the 3 ema and 8 ema. These provide bearish pressures. It would be reasonable to have a pull back and retest the downward Trend Line.

Strangely, while our energy ETF is looking bullish, the Feb. crude oil futures has a bearish setup. I tweeted 15:47 ET today "Oil Futures Mar 4hr showing tweezer top near 78.6% Fib and a Gartley D point.". Initially, this seems like a contradiction, but we're dealing with apples and oranges. The XLE is an ETF constructed by equities, and the CL futures is the actual crude oil commodity itself. So, its perfectly reasonable that these two will sometimes diverge.

CL Mar Oil Futures 4hr Chart


I decided to hold the XLE long position since it appears the bullish indications beat the bearish ones, and we have now resumed the general upward trend.

(We also shorted the March oil futures, but that's a different trade.)

Wednesday, December 7, 2022

Bullish Jan 2023 Beans - Exit

Jan Soybeans Daily at 13:30 ET


Jan Soybeans 5 minute at 13:30 ET


We have a big grains related report due out this Friday 12/9/22, which means its more likely we'll continue in a sideways consolidation until the report than have a consolidation break out. We're at the 78.6% Fibonacci level as well as previous resistance.

Considering price was over the upper Bollinger Band after a good acceleration on the Daily chart, the 5 minute chart is starting to roll over, and we had a 24% gain in our position, I decided it would be best if I sell now (13:30 ET).

I sent a Tweet at 13:41 ET announcing I sold, which gave anyone following me 40 minutes to take action if they wanted to.

Summary: I exited today even though we haven't reached our target because I think we'll go down to sideways until the report on Friday, with no clue what will happen in response to the report.

Bought: Jan 1450/1460 Call Spread for 5 1/8 on 11/29/22 (5.125 * $50 = $256.25)
Sold today 13:30 ET for 6 3/8
Profit 6 3/8 - 5 1/8 = 1.25 * $50 = $62.50 (62.50/256.25 = 24% gain) 

Tuesday, December 6, 2022

Bullish Jan 2023 Beans - Update 5

Jan Soybean Daily


Our patience paid off. At least for today. We made a large green candle on respectable volume, but saw some profit taking later in the day. And we made this Bullish move when many markets were red.

We closed above the 8ema and all the Moving Averages we track. Stochastics are still in the mid-range, so no "resistance" from being overbought. 

I was tempted to close out our position with a little profit because there is a big market moving Ag report coming out this Friday 12/9/22 12pm ET. But now the chart is looking Bullish again so it seems premature to exit today when we still have a couple more days.

So, I held our position yet again.

Monday, December 5, 2022

Bullish Jan 2023 Beans - Update 4

Jan Soybeans Daily

Jan Soybeans 5min


As you can see on the 5 minute chart above, we drifted upward overnight until the US Service PMI Report was released at 10am ET. The numbers were hotter than expected, which the market interpreted as more Quantitative Tightening by the Federal Reserve, which tanked almost every market, including Soybeans.

However, at the end of the day, the 5 minute chart shows we formed a double bottom and tried to climb higher into the Close. But the Daily chart above shows we bounced off the 200dma and closed under the 8ema, with Stochastics in the mid-range. It looks like we may just go sideways until this Friday 12/9/22 when there's a big Agricultural report at 12:00pm ET.

Unfortunately, sideways price action actually seems the most likely, given the circumstances. If we accept that, then the question is do we sell and limit our losses, or thanks to our fixed maximum loss due to using an option spread, hold our position through the report?

Let's review our Risk:Reward. Even though the Soybean market is moving its price action dynamically, our Target hasn't changed, so the R:R hasn't changed. Maximum risk is what we paid for the option spread, which is 5 1/8. 

And the maximum gain is the width of the option spread, minus the remaining extrinsic value when we hit the Target. The width is 1460 - 1450 = 10. If we get a huge bullish response from the Report, then we can say the spread should be worth close to the width. If we trim off half a point, maybe we're close to a maximum value. So, 10 - 1/2 = 9 1/2. As you can probably tell, I'm kind of fudging here. I could go through a more complicated and time consuming estimate, but I'd still have to guess the response to the Ag Report, so I think it would be a waste of time to do the more in-depth analysis.

So, say a best case for a bullish report and selling at our soybean price Target rather than holding 
the position longer, our Risk is 5 1/8 points and the Reward is 9 1/2 points. 

If we were to sell at the end of the day today, we'd have taken a loss of 1 point. 

Bottom line, I decided its worth waiting to see what tomorrow's price action looks like.

Friday, December 2, 2022

Bullish Jan 2023 Beans - Update 3

Jan Soybeans Daily


Today's candle combined with yesterday's form a Bullish signal called a Bullish Harami. But to be a confirmed signal needs to close over the 8ema, which it didn't.

If you consider the down angled congestion as a Flag Pattern then we have come back down and bounced off it. This is a very Bullish pattern if it follows through.

So, based on these promising, albeit premature, indications, and the fixed risk, thanks to our Vertical Option Spread, led me to leave the position on over the weekend.

Thursday, December 1, 2022

Bullish Jan 2023 Beans - Update 2

Jan Soybeans Daily


Looks bad for our long position, but things are not always as they seem. Today's candle, along with the previous 1 or 2 candles, does not make a candlestick sell pattern.

We've had several similar configurations recently, where it looked like we were about to flush to the downside, but then we bounced back upward. Unfortunately, we had more volume today than we did recently, which suggests it might be different this time.

I had said yesterday I was concerned about the overbought Stochastics. Maybe that plus the fact we're in a consolidation, caused a temporary down leg or two. Notice we didn't close below a down sloped trend line. This might just be a retest to be followed by a resumption of the upward price action.

Fortunately, our risk is fixed by the option Call Spread. So, given all this, I decided to hold the position and give the market an opportunity to reverse back into our favor.

Wednesday, November 30, 2022

Bullish Jan 2023 Beans - Update 1

Jan Soybeans Daily (yellow annotations)

We had a very nice Bullish day. Got a higher high and higher low. Formed something close to a Doji Sandwich candlestick pattern, which is Bullish. Closed very close but slightly higher (1649 1/2) than the previous swing high (1469). We had strong volume, and higher volume than yesterday. BB/KC continues towards a break out.

Only thing that gives me pause is that Stochastics are overbought (>80).

We definitely want to stay in this trade.

Tuesday, November 29, 2022

Bullish Jan 2023 Beans

Jan 2023 Soybeans Daily Chart

Went long January Soybeans with a Jan 1450/1460 Call Spread for 5 1/8. Multiplier is $50/pt, so cost was 5 1/8 * $50/pt = $256.25. Today's bean close was 1459 1/2, which means our Call spread is very close to 100% intrinsic value. If the futures price stays over 1460, we'll see the valuation of the option spread widen out from 5 1/8 to 10, which would double our investment. It'll widen out because the time value of the long option will wane as we get closer to expiration on 12/23/2022.

See the yellow annotations on the chart above.

Went long because I see:

  • Flag pattern break out.
  • Scoop pattern about to break out.
  • Bollinger Band/Keltner Channel squeeze about to break out.
  • Left/Right Combo candlestick pattern.
  • Close above the 8ema, with continuation today.
  • High up volume.
  • Above all Moving Averages.
  • No Grain Reports for at least 1 week.
Soon as the order was filled, which was 14:18 ET, 2 minutes before the grain futures market closed, I entered a sell order for 9 3/4.

The expected bullish move of the Jan Soybean futures price is the D point of the AB=CD pattern (see thick yellow angled lines). D can be calculated from 1406.75 + (1469 - 1366.75) = 1509. This is very close to, but just shy of, the previous swing high of 1512.25.

Summary:

Entry: 1459.
Target: 1509.
Stop: not necessary because our risk is fixed and affordable, thanks to the option spread.
Risk: 256.25
Reward: (9 3/4 - 5 1/8) * 50 = 231.25
R:R = 1:1 which doesn't sound great but expect this a high probability setup.

Monday, May 23, 2022

July Corn Possibly About To Pop - Update 7

July Corn Daily


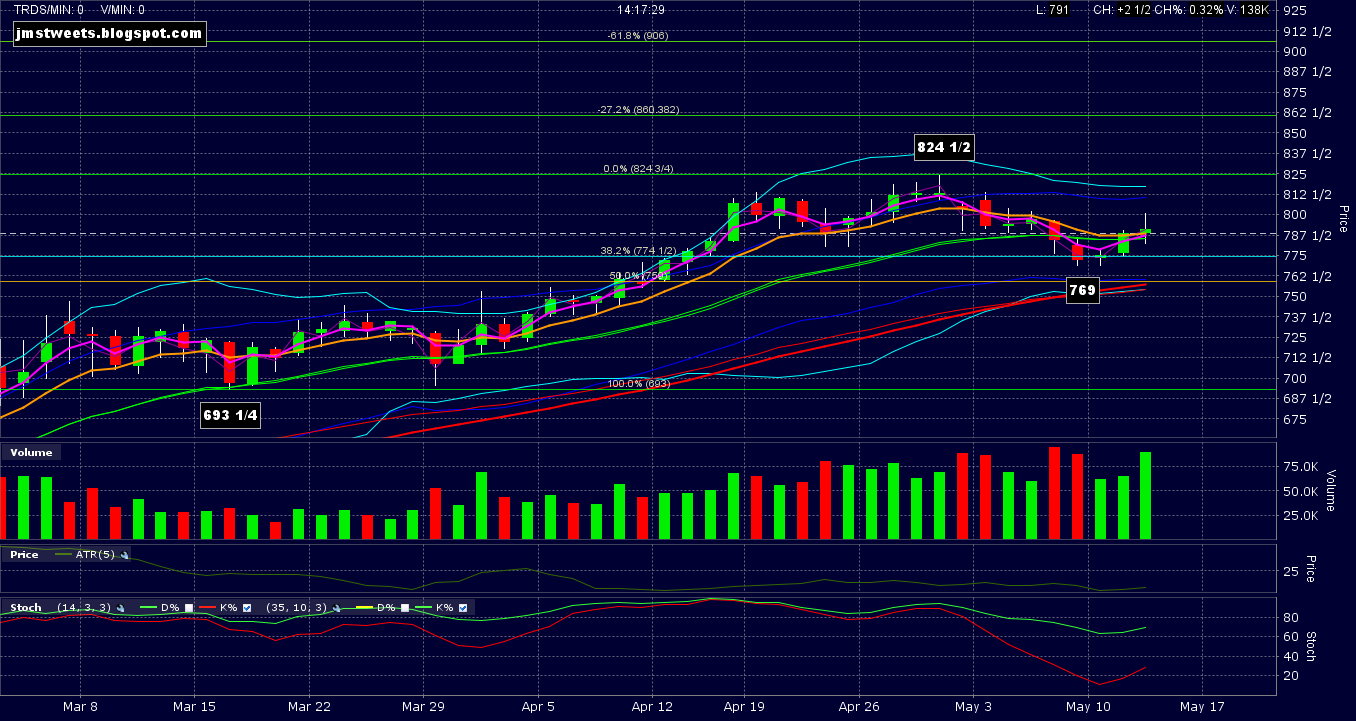
We're still in the Gap, above the 38.2% Fibonacci level, and made a nice green candlestick, closing near the highs. This is somewhat bullish. 

However, we didn't close above the 8ema. In fact, we barely pierced it at all. This isn't very bullish. But we survived the weekend, and the trade still looks viable. 

Its reasonable to interpret this chart to imply we came down to this area to fill in the Gap. We did that. Now we're setting up to resume our upward trajectory.

This trade is going to continue to feel unconvincing until we close above the previous swing high, which was 810 1/4. If you look at the sequential swing highs and lows, you'll see we're forming a sideways wedge (or triangle). See the thin, white, angled lines.


Friday, May 20, 2022

July Corn Possibly About To Pop - Update 6

Sent this Tweet 9:34am ET


Sent this Tweet 14:10 ET


July Corn 15 min Close


Leading up to the Corn market open (9:30am ET), and after, the price action was bouncing between the bottom of the Gap and the 38.2% Fibonacci retracement level from the Daily chart. Its Bullish that we're getting strong support, but on the other hand, we don't have enough strength to break out up through the Gap. So its hard to have any conviction which way we break out of this range.

You can see above where I sent out a Tweet just after the Open that we raised the Stop to just under the swing low at the Gap bottom. That held all day. Nearing the end of the day, and the week, I wanted to exit if we saw any weakness. If we didn't see weakness then I want to stay in the trade over the weekend, thinking we'll continue the previous uptrend.

So, I used the existing Stop as a determinant of weakness. The Stop wasn't hit, so we're still long this trade. 

Thursday, May 19, 2022

July Corn Possibly About To Pop - Update 5

July Corn Daily


Not much to say other than we seem to be getting support from the 38.2% Finonacci level as well as the bottom of the gap. Technically, I should have exited the position today because:

  • We made a lower low and lower high today
  • We closed below the 8ema
  • We made a Doji candle, which is indecisive
  • We made a lower swing high 3 trading days ago

But sometimes its ok to use some human judgement. I think its very likely we came down to fill in the gap, and now we can bottom out and start back up.

So, I want to rely on our Stop and give the trade some slack. If this was a mistake, and I should have gotten out today, then price will continue further down tomorrow and likely hit our Stop. My expectation is we head back up tomorrow.

Wednesday, May 18, 2022

July Corn Possibly About To Pop - Update 4

We got a gap fill exactly as I've been talking about. In fact it was even better than I planned for because it filled the whole gap. I entered the limit order 2 points shy of the full gap because gaps sometimes "mostly" fill rather than completely fill.

I sent these Tweets this morning as it was happening.

9:52am ET


9:59am


10:10am


By the end of the day, the 5 minute chart looked like this:


July Corn 5 min


Notice how we hugged the bottom of the gap all day once we reached it, even though the world was selling off around us today. Also notice the big bullish volume bar at the very end of the day and we closed above the 8ema, 20sma, and 50sma. There is also a possible Bollinger Band/Keltner Channel breakout pending. These suggest we'll drift upward from here. And like Louise Yamada says "The longer the base, the higher in space".

So, bottom line, we're back in this long trade:

Entered: 785
Stop: 768
Target: 860


Tuesday, May 17, 2022

July Corn Possibly About To Pop - Update 3

July Corn Daily


Haven't given up yet. The candles for today and yesterday form an encouraging candlestick pattern called a Bearish Harami. I say encouraging because I want to get back down to fill the gap and catch our limit buy order waiting at 785. Then we can head back up and go for the ride.

Tomorrow's candle could be important, if we don't just drift sideways. If we get a bullish candle tomorrow, I'll probably give up on this trade.

Monday, May 16, 2022

July Corn Possibly About To Pop - Update 2

July Corn Daily

July Corn 15 minute

July Corn futures came down to 792 3/4 after the gap up before heading back up, just missing our 792 limit order to get back in Long after the weekend. It drifted upward from there.

Now expecting a retrace down to 783 to fill the gap and bounce off support. See 15 minute chart (bottom chart above).

Changed our limit buy order to 785. Stop (768) and Target (860) are the same. If we get too close to the Target, I'll have to cancel the buy order.

So, in trying to protect against a big loss from a gap down, we missed the whole trade due to a gap up. No joy in Cornville.


Friday, May 13, 2022

July Corn Possibly About To Pop - Update 1

July Corn Daily


I don't believe this red candle represents a change in trend, however I sold our long position anyway. Why?Because it might be and today is Friday, which means 2 days of uncontrolled price action.

We didn't get a candlestick sell signal but we did get a lower high and a lower low, and a close below the 8ema (orange line). I really didn't like selling but a strategic retreat made more sense than taking an unhedged risk over the weekend in a crazy financial environment.

So, this is a risk management move more than an exit from the trade. That's why the title of this post says "Update" rather than "Exit". I intend to see how we open on Sunday night and maybe into Monday. If conditions warrant, I'll get back in long.

The loss from today's sale is:

781 - 794 1/2 = -13.5 * $10/pt = -$135.

Thursday, May 12, 2022

July Corn Possibly About To Pop

July Corn Daily

July Wheat Daily

Today, 5/12/2022 at 12:00 pm ET, several grain related reports were released by the USDA. Wheat rocketed up, and this is the grain I wanted to buy, but the risk is too high for a pullback to the support level it broke through. So, I may get some wheat if it pulls back then bounces back up.

The corn market had a much more subdued reaction, yet still bullish. You can see yesterday and the day before formed a Doji Gap Up candlestick pattern, after bouncing off the 38.2% Fibonacci retracement level.You can also see Stochastics were oversold at the swing bottom. Finally, we closed over the 8ema and every other MA on my chart, on high volume.

I don't go out of my way to follow fundamentals, but the price of everything is going up in our high inflationary environment, which especially includes food and energy. Corn is used for both. This is generally bullish for corn. Then you have decreased grain exports from major supplier countries and bottlenecks in the supply chain. Also bullish for corn.

Also, the US Dollar has been screaming higher due to a flight to safety to the USD. A strong dollar should diminish prices, but corn rose today as the dollar ETF UUP made a new 2 year high.

So, based on all this bullishness, very near the market close at 14:20 ET, we bought a YC July futures contract for 794 1/2. I managed to get a Tweet out at 14:14 ET. Set a Stop at 768, just below the recent swing low, and a Target at 860, shading the 127.2% Fibonacci extension of 860.382 by just a little. We're using the YC mini-contract ($10/pt) rather than the full sized contract ($50/pt) to contain risk.

Summary:

Entry 794 1/2
Stop 768
Target 860

Risk 794 1/2 - 768 = 26 1/2 points
Reward 860 - 794 1/2 = 65 1/2 points
R:R = 65.5/26.5 = 2.5:1 which is great.

Monday, March 14, 2022

June AUD/USD Russian Doll Gartley Patterns - Exit


At 15:38 ET I Tweeted:

"The 2nd Target we were waiting for was .7201 on the Gartley AUDUSD trade. When I checked it I saw it reversed at .7202! So I sold it at the market at .7217. Details later."

Because I had a Stop and a Limit order working, I didn't need to check on this trade very often. When I did check, I was shocked but not surprised price had dropped to within 1 pip of our Target and then reversed up. That's so close that I needed to assume that was the swing bottom, and I better get out immediately. Unfortunately, the Ask was .7217, but it didn't matter. If we did establish the swing bottom, then the odds are price will continue upward. It doesn't make sense to hang on, hoping it might dip down.

But, of course, the trading gods love to add insult to injury, so soon as I covered the trade, price headed back down to a low of the day at .71955:


Had I not checked on the chart at all, it would have hit our 2nd Target and then some.

With regard to the yellow range Gartley pattern, the first 3 targets were hit. The 4th target is very seldom ever hit.

So, bottom line:

Target 2:

Enter .7372
Exit: .7217

.7372 - .7217 = 155 pips * $1.00/pip = $155. If we used the full sized contract, it would have been $1,550.

Target 1 profit: $68
Target 2 profit: $155
Total: $223


Friday, March 11, 2022

June AUD/USD Russian Doll Gartley Patterns - Update 1

1 Hr Chart

15 Minute Chart


You can see on the 1 hour and 15 minute charts above, in the purple, that a 3rd Gartley pattern developed over night last night. I tried trading it but after the D point, price only got up to .73425, which is less than even the .5AD level. Then it meandered downward and broke the X point.

I admit it was weird trading a Bullish pattern when the other bigger patterns were Bearish. But you can see a nice up leg when the C point formed. So it was very reasonable to anticipate we could hit the .618AD of the purple range. 

And, I have learned that when you have a methodology with a proven edge, then you must take every set up, because you never know which individual trade will fail. The Gartley has a proven win rate of about 75%. So, even though this 3rd pattern was in the opposite direction of the core trade, I had to take it.

Now for the good news. The Target for the yellow range was .7304, as described in the previous post. We hit that at exactly 15:00 ET. So the first of the 2 planned trades has completed, and we have the other one still working.

Since the 3rd pattern that developed overnight, and failed, was not a planned aspect of this trade, I'm going to leave out the P&L from that separate trade.

The profit from the 1st half of the trade is:

.7372 - .7304 = 68 pips * $1.00/pip = $68. If we used the full sized contract, it would have been $680.


Thursday, March 10, 2022

June AUD/USD Russian Doll Gartley Patterns


This is going to be a crazy trade. I was setting up the Gartley pattern on the AUD/USD 60 minute chart above and when I was finished, I noticed there's another smaller Gartley pattern inside the first.

The bigger Gartley, let's call it the 1 hour (1h) Gartley, is still establishing its C point. I was going to wait for the D point before entering a trade. But the smaller Gartley, let's call it the 15 minute (15m) Gartley, is establishing its D point. 

The 1h Gartley has white comments and green Fibonacci's. The 15m Gartley has yellow comments and yellow Fibonacci's.

So, we can enter the 15m Gartley, but instead of using the usual .618AD Target, we can go for a bigger Target of the 1h Gartley D point. However, I want to be conservative and trade each pattern separately.

I got 2 AUD June futures using mini-contracts because the risk is 85 pips. If I used 2 full contracts I'd be risking $1,700.

I bought the 2 futures at .7372. The Stop for both is just over the X,A point at .7457. The first Target is the .618AD of the 15m Gartley. Using the current D value of .73775, the Target is:

.73775-.618(.73775-.72555)=0.7302104

The second Target is the 78.6% Fibonacci of the 1h Gartley XA leg, which is .71797. Also, using the current C point, the calculated D point is:

.73775-(.7455-.72555)=.7178, which is amazingly close to the .71797 Fib.

We'll shade the second Target a bit because on the way there, we'll encounter the .7200 level, which is a round number. You might point out we'll also be encountering the .7300 level, but that's nowhere close to the Target. Also, there is some possible support from a gap down and swing low from late February. This adds to desire to shade the second Target up to the .7200 level.

Now, here's more craziness. There's a speaking engagement in Australia by RBA Govenor Lowe at 17:15 ET, while the FX market is closed between 17:00 - 18:00. So, come 18:00 this evening, we may get a gap open but there's no telling in which direction. I could have waited until after 18:00 to enter, but I decided I can handle the risk.

Bottom Line:

Trade 1

Enter: .7372
Stop: .7457
Target: .7304
Risk: .7372 -. 7457 = -85 pips.
Reward: .7372 - .7304 = 68 pips.
R:R : 68/85 = 1:0.8 This looks bad but remember the Gartley pattern has a 75% Win Rate, which means you could have a R:R of 1:0.3 and still break even. Plus we have the 1h Gartley that may pull down price further than usual.

Trade 2

Enter: .7372
Stop: .7457
Target: .7201
Risk: .7372 - .7304 = 68 pips.
Reward: .7372 - .7201 = 171 pips.
R:R = 171/68 = 1:2.5 which is great.

Wednesday, March 9, 2022

Live Cattle Megaphone - Exit

3/4/2022 15 minute 10:52 ET


On March 4th at 10:59am ET I sent this Tweet with the 15 minute chart above:

"Sold our long April Live Cattle Futures position for a small profit. Price dropped to far at the open. Sold it on the bounce. Details later."

The ideal low point would have been the 127.2% Fibonacci extension at 136.405. But price shot right through there and came close to the 161.8% extension. Then retraced upward but bounced off the 8ema and headed back down.

This didn't look like it was honoring the megaphone pattern at all. Thus our thesis was violated and we had no reason to stay in the trade.

The original buy order described in the previous post was filled at  9:30:13 ET for 1.050. I sold it for 1.125 on the bounce at 10:52:40. So, the net was:

1.125 - 1.050 = .075 * $400/pt = +$30.00

At today's close on 3/9/2022 the Daily chart looks like this:

3/9/2022 Daily Close


That is still not right for a megaphone trade.