Wednesday, January 27, 2021

PEG Looks Bullish - Exit


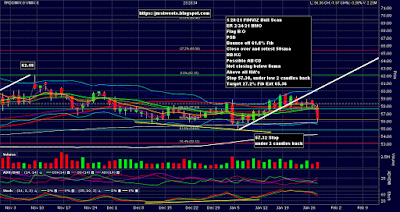
We had a few days of doji's riding the 8ema. Nothing to do but wait for a decisive breakout. Well, that came today when our Stop was hit. Pretty simple.

 Entered with Jun 60 Call $2.70
Stopped out at 10:17am ET for $2.05
205 - 270 = -$65 loss per option.

Friday, January 22, 2021

PEG Looks Bullish - Update 1


PEG made a Bearish Harami candle pattern yesterday but closed above the 8ema. It bounced off the 20sma and 50sma today and closed just above the 8ema.

So, holding the position for now.

BTW, one of the reasons I chose this stock to trade is because it has a Beta < 1, which means it's not very corrrelated with the S&P 500 Index. Ideally, I'd like to trade stocks with a 0 Beta, so they're trading on their own technicals. But not many of those stocks out there.

Wednesday, January 20, 2021

PEG Looks Bullish


I ran a scan on Finviz.com and found this bullish looking chart on the PEG stock Daily chart. Here's what I saw:

  • Flag Breakout
  • Positive Stochastics Diversion 
    • See angled yellow support line segments under Price and Stochastics
  • Bounced off 61.8% Fibonacci
    • See light blue Fib line
  • Close over and retest 50sma
  • Bollinger Bands/Keltner Channel Breakout
  • Possible AB/CD
    • See thick angled duplicated white line segments
  • Not closing below 8ema past 8 days
  • Above all Moving Averages
  • Morning Star candle pattern
A negative in this setup is the overbought Stochastics. However, look at the Stochastics between 9/28/20 - 10/27/20. Notice they are pegged (no pun intended) in the overbought area while price continued upward from 50.32 - 61.89. Why can't that happen again?

It would be safer to wait until we've closed over the previous high swing point at 62.15, but given all the bullish indications and the overall bullish stock market, I don't think its very imprudent to enter early.

So, at 3:14pm ET, after giving today's candle a chance to do what its going to do, I got a June 60 Call for $2.70. The cost nor the Theta decay warranted a spread, in my opinion, so I just got a simple Call.

Set the Stop just under the low of 2 candles before the current candle. The low of the 2nd candle back is 57.32. I set the Stop to 57.30.

There are many ways to trail a Stop. I like trailing the low of 2 candles back. Candles violate the low of the adjacent previous candle, and then continue with the trend, much more frequently than the low of 2 candles back. We're not actually going to trail this Stop for some time, if ever, but trailing Stops is where I got the idea to place the Stop for this trade.

A more typical and "proper" Stop would be under the swing low of 54.96, like maybe 54.90. But since the Stochastics are overbought, I wanted to use a tighter Stop.

Considering a Target, notice the AB/CD terminates over the 27.2% Fib extension but before the 61.8% Fib extension. Because of this, and the high Stochastics, I want to set a conservative Target. So I set it to 65.36, just before the actual 27.2% Fib of 65.38. I like to shade actual targets a little to account for slippage, Bid/Ask Spreads, and outright near misses. Two cents isn't really enough but the AB/CD suggests price will exceed the 27.2% Fib by a generous margin.

Entry equivalent 58.85
Stop 57.30
Target 65.36

Entered with Jun 60 Call 2.70
Delta .463, Gamma .048

If we hit the Target at 65.36 then price will cover 65.36-58.85=6.51
Gamma indicates we should add .048*6.57=0.31248 to our initial Delta of .463, or 0.77548, or .775 with rounding.
If we average these to get a rough effective Delta, (.463+.775)/2= .619
So, our reward is approximately 6.57 profit * .619 Delta * 100 shares = $406.68
Our risk is the cost of the option, 2.70 * 100 = $270

So, Reward:Risk = 406.68/270 = 1.5:1, not great but acceptable.

Friday, January 8, 2021

Thor Industries, Inc. Weekly Bullish Gartley Re-Entry - Exit


Guess we can blame it on the NFP Report this morning with a loss of 140K jobs vs the expectation of +60K new jobs. Whatever the cause, THO tanked and hit our Stop when the stock hit 95.36 at 14:50 ET. The sell price for the Feb 105 Call option was 3.10.

Since we formed a Bearish Engulfing pattern and closed below the 8ema, plus the ADX crossed Bearish and its a Friday. So, even if our Stop wasn't hit, I should have exited at the close today anyway.

I think I've had it with this stock. The option Bid/Ask spreads are terrible and without using options, the share price is just high enough that we'd need to tie up a lot of stock to get a standard 100 lot position. I've only been trading THO because of the great Bullish setup, but this annoying price action has whipsawed us in and out twice already. That's enough. There are many, many other things we can be trading.

So, summary:

Entry: 395
Exit: 310
Net: -$85.00 loss

Done with this trading vehicle.

Thursday, January 7, 2021

Thor Industries, Inc. Weekly Bullish Gartley Re-Entry - Update 1


Today we gapped up and came very close to reaching the previous swing high before retracing by almost 50% by the close. We did the same thing yesterday and with more volume but less price range. It'll be important to see how we deal with the previous swing high level at 103.35 when we get there. Probably tomorrow. Although, tomorrow is Non-Farm Payroll Report at 8:30am ET, which can swing the market in any direction, so who knows.

Today's bottom wick did not fill the full gap. That's a sign of strength, at the moment. However, going forward there will be some unfinished business closing that gap, which I like to call "pressure" but its not really pressure. It would be nice to hit our target before reversing enough to finish closing the gap. If we fill the gap before hitting our target then we'll have to endure some heat. If we fill the gap and close under the 8ema, we may have to close out of the position.

I added the 2 thick, yellow, angled lines to show a short term AB/CD. We're going to need a CD length extension, like 1.272 or 1.618 the length of AB to avoid taking some heat very soon, probably tomorrow.

Notice we still have plenty of room in the Stochastics before becoming overbought.

The Feb 115 Call short hedge I explained yesterday high today was 2.30, so we're not yet close to the 4.00 target.

Bottom line is we're looking strongly bullish at the moment.

Wednesday, January 6, 2021

Thor Industries, Inc. Weekly Bullish Gartley Re-Entry


I concluded the 12/28/20 post in this thread with "We'll monitor the THO chart and look for an entry for a new long position." Found it today.

This morning before the market opened, I noticed THO had bounced off the 50sma and was peeking over the 8ema and 20sma. The bid/ask spread on the options are terrible, but its still a better alternative than a decent amount of the stock. I used the stock last time and it tied up a lot of equity. The world was crazy then (12/23/20) but its even more crazy now. So today I really preferred defined risk at a fraction of the stock value I'd have to put at risk.

The option market is closed pre-market so I had to wait but I knew I'd be busy at the open. However, since this stock moves fast across price ranges, I wanted to catch it before it got away from me. 

So here's what I did. I entered a conditional buy order for a Feb 105 Call. The condition was that the stock price was between 97.50 and 98. The thinking is if it hits 97.50 then its going higher. Of course, that's not necessarily true, and the 97.50 figure was by eye, so its a bit risky. I specified the upper limit of 98 in case it gapped up on the open, or option trading was delayed while the stock rocketed upward.

If you look at today's chart you can see the Open and the Low of the day were equal (95.41). This is another bullish indication. At 9:52am ET the order triggered and we got a Call for $3.95. When the order filled I added a Target at just below the 61.8% Fib extension of the green range at 113.64 and a Stop just below today's open at 95.36.

Interactive Brokers has an order type called a "Snap-Mid". This results in a limit order where the limit is the midpoint of the Bid/Ask spread. I used this for the Target and the Stop. I also added a backup Stop that would result in a market order a little lower at 94.36 in case the Stop-Limit doesn't fill. Of course, I used the same OCO (aka OCA) code that will close all the other orders when any of them fill.

Later in the day, I noticed we had a nice paper profit. This stock is so dynamic relative to price levels that achieving a risk free trade would be very, very desirable. So, what I did was enter a limit order to sell a Feb 115 Call at $4.00. Remember, we paid $3.95 for the 105 Call, so if we sell the 115 Call for $4.00 we'll have no risk! The downside is our profit will be limited to a fraction of the 115-105=$10 spread. A $10 equity in an equity option is worth $10 x 100 shares = $1,000. If this hedge order triggers we'll be in a 105/115 Bullish Call Vertical Spread at zero cost. Not a bad thing.

Here's the bullish indications I saw that got us in:

  • Retest, Bounce off 50sma
  • Left/Right Combo
  • Slow round curve
  • Close over 8ema
  • Above all MA's
  • ADX Cross
Summary (Feb 105 Call):

Entry 3.95
Stop when Stock = 95.36
Target when stock = 113.64
Pending hedge order to sell Feb 115 Call at $4.00