Daily
Weekly
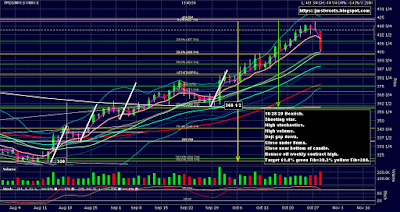
Dec Corn setup a short trade. Entered using the YC contract, to control risk, at the close at 401. Here's what I saw on today's Daily chart:
- Shooting star candle pattern.
- High stochastics.
- High volume.
- Doji gap down candle pattern.
- Close under 8ema.
- Close near bottom of candle.
- Bounce off weekly contract high (see Weekly chart above).
Target is 61.8% Fibonacci retracement of the green range, which coincides with the 38.2% Fib retracement of the yellow range, which is 384. Actual target is set to 384 1/4 to account for Bid/Ask spread and slippage.
Stop is 415 1/2 which is just over today's high.
Risk: 401 - 415 1/2 = -14 1/2 * $10/pt = -$145.00
Reward: 401 - 384 1/4 = 16 3/4 * $10/pt = $167.50
R:R 167.50/145 = 1:1.16 not very good but acceptable given a high probability setup.


No comments:
Post a Comment