Showing posts with label XLE. Show all posts

Thursday, January 19, 2023

XLE Re-entry - Exit

XLE Daily

XLE 3 minute


At 9:34am ET I Tweeted "Sold our long $XLE #XLE position. Details later.". Here are the details:

We opened gapped down, then filled the gap. Then we started back down, as you can see on the 3 minute chart. I have seen, many, many times, when this price action occurs, you get a continuation to the downside. It seemed very likely that we'd drift back down to the Trend Line and reverse back up.

Since we're using options for this trade, we're losing value daily due to Theta time decay. Plus, options are leveraged instruments, so we'll lose value in our position much faster than the underlying ETF. So, why go for that ride down to the Trend Line, and possibly much further down if we don't bounce off of it. Its better to exit now and wait for the reversal off the the Trend Line. That's why I sold the options.

However, look how we closed on the Daily chart. Today's candle combined with yesterday's forms a Piercing Pattern candlestick pattern. This is a Bullish signal, except its usually actionable when Stochastics are oversold. Currently we're barely out of overbought territory, nowhere near being oversold. 

Still, a Piercing Pattern plus a close above the 8ema, and every other Moving Average we track, as well as the recent Bollinger Bands/Keltner Channel Squeeze Breakout, makes me think it would have been better to wait until the end of the day, as I usually do.

I thought about getting back in long at the end of the day, but its bad to get caught in a sideways thrashing price action. So, I decided being out is probably the best choice. There's still plenty of runway to get back in long if we want to when the setup looks worthwhile.

For now, here's trade result:

XLE Mar 95 Call
Bought at 2.55 1/9/23, sold today 1.64, loss -$91. 
Bought at 1.99 1/9/23, sold today 1.64, loss -$35.
Total -$126/454=-28%.

Wednesday, January 18, 2023

XLE Re-entry - Update 3

XLE Daily


Now the buy/sell/hold decision is getting harder. We had a significant down day on decent volume. Today's and yesterday's candles formed a Left/Right Combo candlestick pattern. Stochastics are still high and there's still a tiny little gap below us. It's not unusual at all for a breakout to do a small reversal and test the breakout level, or in this case, the Trend Line. These can indicate a bearish move of about 3 points or so, down to the Trend Line, which is coincident with the tiny gap.

On the other hand, we found support at the 50sma and 8ema, which happen to be coincident today. This could suggest a reversal tomorrow and continuation with the up trend.

It seems like a 50/50 bet from here. But since we're in an uptrend, and we found support, and not closed below the 8ema, I decided to hold the position.

Tuesday, January 17, 2023

XLE Re-entry - Update 2

XLE Daily


Well, you can see we had a higher high and higher low today, and we closed above the 3ema. Also, you can see the Bollinger Bands are blossoming outward. These are good bullish indications.

However, we closed near the bottom of the candle, and Stochastics are extremely over bought. Also, we are coming into a previous congestion area from the month of November. These indicate risk of a reversal. If we do reverse, then it'll be a question of how far.

It looks like we might be at an inflection point. We'll probably find out this week. We still have a distance to go to get to our 102.50 Target.

Thursday, January 12, 2023

XLE Re-entry - Update 1

XLE Daily


Looking good today! After bobbling between the downward Trend Line and the 50 SMA for a few days, we gapped up at the Open above the 50 SMA and stayed above it all day. We had decent volume, decent size green candle, and looks like we got a Bollinger Band/Keltner Channel squeeze breakout to the upside. We closed above all Moving Averages and closer to the top of the candle than the bottom. All this is bullish.

Unfortunately, we also entered a previous congestion area to the left, and Stochastics are now in the overbought area. We closed a little stretched above the 3 ema and 8 ema. These provide bearish pressures. It would be reasonable to have a pull back and retest the downward Trend Line.

Strangely, while our energy ETF is looking bullish, the Feb. crude oil futures has a bearish setup. I tweeted 15:47 ET today "Oil Futures Mar 4hr showing tweezer top near 78.6% Fib and a Gartley D point.". Initially, this seems like a contradiction, but we're dealing with apples and oranges. The XLE is an ETF constructed by equities, and the CL futures is the actual crude oil commodity itself. So, its perfectly reasonable that these two will sometimes diverge.

CL Mar Oil Futures 4hr Chart


I decided to hold the XLE long position since it appears the bullish indications beat the bearish ones, and we have now resumed the general upward trend.

(We also shorted the March oil futures, but that's a different trade.)

Tuesday, January 3, 2023

XLE Looks Positive - Exit

XLE Daily


Tough decision today. We closed closer to the low than the high, below the 8ema on high volume. We never got over the downward Trend Line, not even on an intraday basis. Stochastics are still above the mid-range, so there's plenty of room to fall further before worrying about being oversold.

But on the other hand, we're still in the congestion area and haven't broken out to the downside. We could easily reverse this price action tomorrow. Plus we're in an option, so our risk is fixed to the cost of the option.

Bottom line, given the relatively larger candle and higher volume, and the clear resistance from the Trend Line and the 50sma, and the priority of capital preservation over "being right", I decided to take a small loss to avoid taking a bigger loss.

Of course, we can always buy back in if appropriate. To that end, I set an alert for when XLE >= $89.

Summary:

XLE Mar 95 Call bought at 2.22 on 12/21/22, sold 1/3/23 for 1.58
158 - 222 = -$64 per contract.

Thursday, December 29, 2022

XLE Looks Positive - Update 4

XLE Daily


Yesterday I said "If we close above the 8ema tomorrow, then it will look even more like a bobble between MA's." Well, we closed today above 8ema, and about half way up yesterday's candle. So now I expect we'll bobble between the 50sma, which is coincident with the downward Trend Line, and the 8ema, until we break out one way or the other.

If you look at this chart from the swing low at 68.66 forward, then you'll see the downward trending channel we're in, combined with the upward trending channel that precedes it, form a Flag pattern. The expected breakout from the downward channel is to the upside, which would continue the general uptrend you'd see on a higher Time Frame.

The fact that we bounced off the .382 Fibonacci also suggests we're going higher. But trading is a probabilistic enterprise, not a deterministic one, so we'll read the tea leaves the best we can, and remember risk control and capital preservation are the top priorities.

Wednesday, December 28, 2022

XLE Looks Positive - Update 3

XLE Daily


Today's chart looks worse than it probably is. It did form a red candle with no top wick. But we didn't close below the 8ema.

Yesterday I said "we're right up against the 50sma which could provide resistance, and put us in a bobble between the 8ema and the 50sma". So far, it looks like that's what's happening. If we close above the 8ema tomorrow, then it will look even more like a bobble between MA's.

Certainly there's not enough evidence to exit the trade. Not yet anyway. So we held the position. 

If we close below the 8ema tomorrow, and near the bottom of the day's range, then we'll have to think seriously about getting out. But we may want to wait and see if there's follow through the next day. It'll depend on the actual situation near the Close. For example, if the options have very little value left in them, then it may make more sense to hold on to them for a possible bounce.

Tuesday, December 27, 2022

XLE Looks Positive - Update 2

XLE Daily


Good news is we may have broke out of the congestion and made a higher high and a higher low than the candles since the recent swing low. We're above all the Moving Averages except for the 50sma. Stochastics are not yet overbought. We're continuing to move away from the .382 rather than retest it again. This is all Bullish and supports our trade.

But on the other hand, we're right up against the 50sma which could provide resistance, and put us in a bobble between the 8ema and the 50sma. We haven't yet broken the downward Trend Line. We haven't formed a Bullish candlestick pattern since the recent swing lows, although we may have formed a Double Bottom. Volume is mediocre. This does not paint a particularly Bullish picture.

Bottom line, its an easy decision to hold the trade.

Thursday, December 22, 2022

XLE Looks Positive - Update 1

XLE Daily Chart


Today was a big day for many of the markets, but just noise within the current sideways congestion/consolidation for XLE. We even closed right in the middle of it. A non-material day.

Tomorrow is the trading day before Christmas. I'm told that is an up day about 75% of the time. I'm expecting a reversal in XLE, but not much of a break out from the congestion range.

Wednesday, December 21, 2022

XLE Looks Positive

XLE Daily


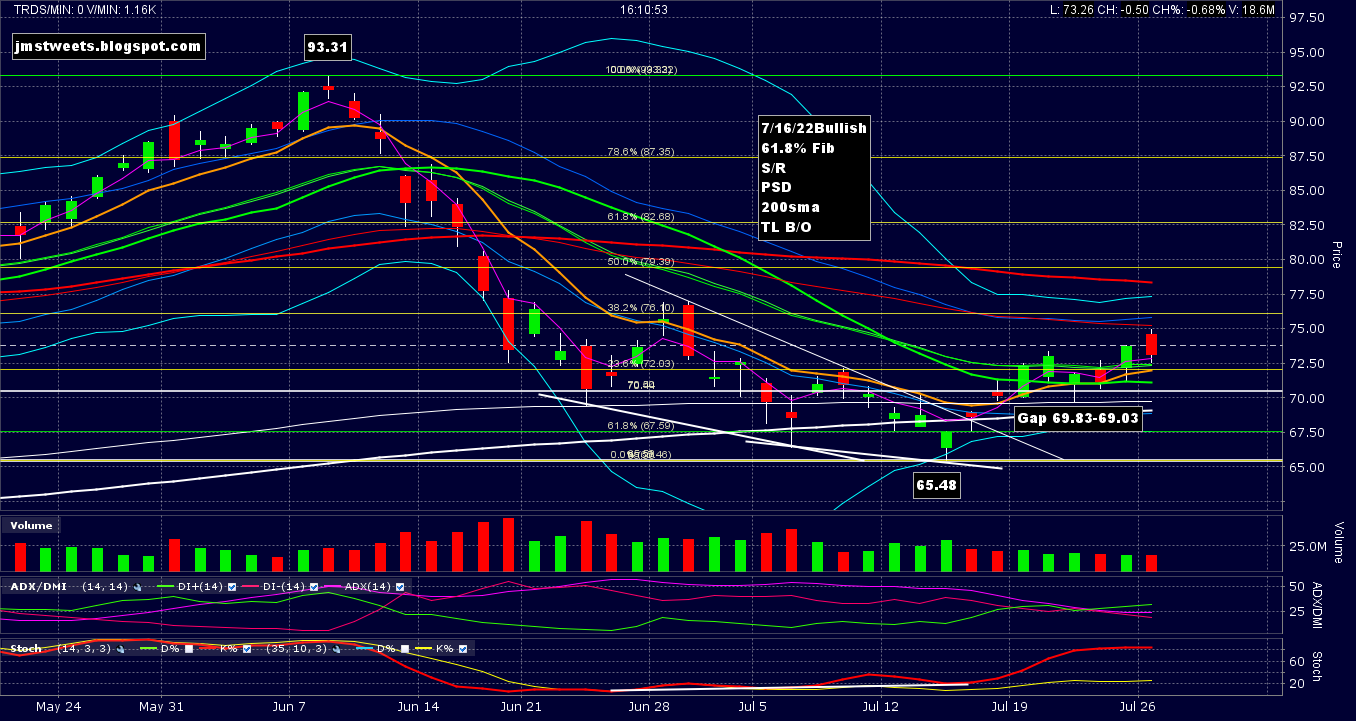
The applicable part of this Daily chart, regarding this trade, begins at the 65.48 low on 7/14/22. If you draw Fibonacci levels from the recent 94.71 swing high on 11/14/22 down to the 65.48 low on 7/14/22, you'll see the current swing low at 82.65 on 12/9/22 is very close to the 38.2% Fib retracement.

Notice the price action from 94.71 to 82.65 is in a AB/CD format. See the 2 little white, downward angled, diagonal lines. And, the 82.88 swing low 2 days ago made a higher low than the 82.65 low.

Also, Stochastics, on the bottom of the chart, are extremely low at the 82.65 low.

A setup like this can lead to a substantial bounce up to the -27.2% Fib extension at 102.64. It would have been better for me to wait until the Close today to see if we close over the 8ema. Its mid-day and we are over the 8ema but I should wait a few more hours. But I'm going to be busy with other trades I have planned near the close, so I'm going to jump the gun, but use options to limit my risk to a defined amount, which is the cost of the options.

So, I got an XLE March 95 Call for 2.22. I picked March to allow enough time for the trade but also to control the Theta time decay. Also, this option has a 30% Delta, which is an inflection point in the Delta vs underlying curve, meaning Delta accelerates its increase from 30% to 70%.

The Target is the -27.2% Fib extension at 102.64. This also coincides with the price swing from 7/14/22 to 8/29/22, as represented by the thick, white, upward angled, line. The next price swing is longer, which doesn't hurt. 

I almost always shade my entries, stops, and targets to account for slippage and bid/ask spreads. So, my actual exit is when XLE is 102.50.


Wednesday, July 27, 2022

Energy May Be Turning On - Exit

XLE 3 minute


We had a little gap up at the Open followed by a retracement to fill the gap. This is the same behavior as yesterday, when I described it as a possible "Exhaustion Gap". 

Given 2 days of this price action, and the Federal Reserve FOMC rate decision announcement later today at 14:00 ET, it seemed like a good idea to exit with what profits we had left, and wait out the announcement.

Sold the XLE Sep 75 Call for 3.54 at 10:30am ET. Profit is (3.54 - 3.05) * 100 = +$49. per option.

49/305 = 16% gain. Not bad for 9 calendar days. If you annualized it, it would be 16 * 365/9 = 649% annual return.


Tuesday, July 26, 2022

Energy May Be Turning On - Update 4

XLE Daily


Today's price action is both good and bad. 

Its good because we gapped up at the open. We made a higher high and a higher low. We closed above the 8ema, and also the 3ema.

Its bad because we gapped up on high Stochastics. This could be interpreted as an "Exhaustion Gap".  Exhaustion Gaps can indicate an end to the current trend, which would mean price starts heading down from here. We also came close to forming a Dark Cloud Cover candlestick pattern. Such a pattern can also indicate an end to the current trend.

A Dark Cloud Cover needs to close below the 50% midpoint of the previous candle. The endpoints of the previous day's candle body are 72.13 - 73.76. The midpoint is (72.13 + 73.76)/2 = 72.95. The endpoints of the previous day's full candle are 71.27 - 73.83. The midpoint is (71.27 + 73.83)/2 = 72.55. Today's close was 73.09, so technically we did not form a Dark Cloud Cover candlestick pattern. 

If you look at the red candle from 7/22/22 and the green candle before it, you'll see a valid Dark Cloud Cover candlestick pattern. However, even though that was on high Stochastics, we continued upward this week. Another example of the same thing are the candles from 5/31/22 and 5/27/22. You can see them on the chart above.

After considering what was on the chart at the end of the day today, I decided to hold the position.

Monday, July 25, 2022

Energy May Be Turning On - Update 3

XLE Daily


We recovered well from the little dip. Today and the previous candle both made higher highs and higher lows. We haven't closed below the 8ema since we entered the trade. And we have a relatively clear path to the 50sma Target.

Short term Stochastics are high, but if you look back to May 17th through June 10th, you'll see Stochastics pinned near the top as price continued higher. So, this can happen again.

We may encounter some resistance at the previous swing high around 77 on June 29th. But the 50sma (our Target) is gently sloping down. So it may be close to the 77 level anyway.

We made a nice green candle today and the trade is on.

Thursday, July 21, 2022

Energy May Be Turning On - Update 2

XLE Daily


We were doing so well, but today we took a dip. We created a lower high and lower low for the day, which is not what we want to see. Also, Stochastics are knocking on the door of the oversold level.

However, we managed to crawl back and close above the 8ema and the 20sma. So, I think we're still good. At least to hold overnight tonight.

The 50sma Target closed at 78.66, so we left our 78.50 Target unchanged.

Tuesday, July 19, 2022

Energy May Be Turning On - Update 1

XLE Daily


Today's price action was an excellent confirmation we're on the right track. Look at today's candle. The Open was 70.06 and the 70.04 low was immediate and negligible. The Close was 72.32 and the high was 72.50. Very close to the Close. This shows XLE was on a mission to climb today.

We opened right on the 8ema, penetrated the 20sma, and closed well above it. Combined with yesterday's Doji candle, we formed a Left/Right Combo candlestick pattern, which is Bullish.

Also, the ADX did a Bullish cross. Plenty of room before Stochastics become overbought.

The 50sma closed at 78.95, so didn't need to change our 78.50 target.

Bottom line, we had a very Bullish day. Our September 75 Call increased from 3.05 to 3.60. That's a .55/3.05 = 18% increase. Looking good!


Monday, July 18, 2022

Energy May Be Turning On

XLE Daily


XLE looked bullish enough this morning to go long. Got a XLE Sep 75 Call for 3.05.

Here's what I see:

  • Bounce off the 61.8% Fibonacci level
  • Bounce off Support/Resistance level around 65.50
  • Positive Stochastics Divergence
  • Bounce off 200sma
  • Trend Line Breakout
  • Close over the 8ema
Set the Target to the 50sma at about 78.50. This will need adjustment as the 50sma is slowly descending.

Set the Stop to just under the 65.48 swing low at 65.36.

I'll look at the risk/reward in terms of the stock rather than the complicated theoretical estimate of the option:

Risk: 70.36 - 65.36 = 5.00
Reward: 78.50 - 70.36 = 8.14
R:R = 8.14/5 = 1.628:1 Not very good but its a rough estimate and fixed maximum loss.