Showing posts with label Wheat. Show all posts

Thursday, May 12, 2022

July Corn Possibly About To Pop

July Corn Daily

July Wheat Daily

Today, 5/12/2022 at 12:00 pm ET, several grain related reports were released by the USDA. Wheat rocketed up, and this is the grain I wanted to buy, but the risk is too high for a pullback to the support level it broke through. So, I may get some wheat if it pulls back then bounces back up.

The corn market had a much more subdued reaction, yet still bullish. You can see yesterday and the day before formed a Doji Gap Up candlestick pattern, after bouncing off the 38.2% Fibonacci retracement level.You can also see Stochastics were oversold at the swing bottom. Finally, we closed over the 8ema and every other MA on my chart, on high volume.

I don't go out of my way to follow fundamentals, but the price of everything is going up in our high inflationary environment, which especially includes food and energy. Corn is used for both. This is generally bullish for corn. Then you have decreased grain exports from major supplier countries and bottlenecks in the supply chain. Also bullish for corn.

Also, the US Dollar has been screaming higher due to a flight to safety to the USD. A strong dollar should diminish prices, but corn rose today as the dollar ETF UUP made a new 2 year high.

So, based on all this bullishness, very near the market close at 14:20 ET, we bought a YC July futures contract for 794 1/2. I managed to get a Tweet out at 14:14 ET. Set a Stop at 768, just below the recent swing low, and a Target at 860, shading the 127.2% Fibonacci extension of 860.382 by just a little. We're using the YC mini-contract ($10/pt) rather than the full sized contract ($50/pt) to contain risk.

Summary:

Entry 794 1/2
Stop 768
Target 860

Risk 794 1/2 - 768 = 26 1/2 points
Reward 860 - 794 1/2 = 65 1/2 points
R:R = 65.5/26.5 = 2.5:1 which is great.

Wednesday, January 12, 2022

High Risk March Wheat Long - Exit


Above is the Daily chart at 10:46am ET. I was looking for an up move into the 12:00pm Ag reports, but we were just stuck in place waiting for the reports. So after waiting over an hour, I decided to get out because it seemed very likely we would continue to stall until 12pm.

I sent the following Tweet at 10:46

"Bailed on the Mar Wheat Futures trade. We're just gonna stay in this tight range until the report comes out at 12pm ET. Just sold for 764 1/2 for a 4 1/2 point loss."

Since I used the mini-contract, that's 4.5 pts * $10/pt = -$45. Not bad for a high risk trade.

Then at the Close, the Daily chart looked like this:


It looks like maybe we're heading back down, but we didn't form a candlestick sell signal, and Stochastics are in the mid-range. Plus, Corn is neutral and Soybeans are going up!

So, I'm not ready to get back into Wheat again yet.


Tuesday, January 11, 2022

High Risk March Wheat Long


Like the title says, this is a high risk trade at the time I entered it, which was at the Close today for 769. One reason its high risk is because we don't have confirmation yet, which would be a higher Close, or higher high and higher low, by the next trading day or two.

But a much greater reason for high risk is that the quarterly "Grains Stocks Report" is due out tomorrow 12:00pm ET. This can whipsaw the grains markets, and unless you hire Mr. Beeks, the reaction to the report is a craps shoot. So we do not want a position in the market at 12:00pm.


Must See Movie "Trading Places"

However, due to what I see on the Daily chart above, the odds suggest we should get some more upside, at least up to the Report release. Here's what I see (yellow box on the chart):

  • Bullish Engulfing candlestick pattern
  • Doji Sandwich candlestick pattern
  • Close over the 8ema
  • Low Stochastics
  • Tweezer Bottom candlestick pattern
  • Support from Head & Shoulders half measured move 1st Target
  • Support from AB=CD 760.50 D point
  • Support from 200sma
Since its a high risk trade, I'm using a tight Stop of 747, just under the bottom of the previous Doji candle low. Also using the YW $10/pt mini-contract.

For the Target, I'm looking at the 808 1/2 end point of a clone of the previous leg up. See the thick, forward angled, yellow lines. But I'm shading it a bit to the 50sma, which coincides with the Head & Shoulders Neckline, at about 795.

IMPORTANT: I'm setting an automatic conditional order to sell the position, no matter what, at 11:45am ET.


Tuesday, January 4, 2022

March Wheat did an about-face - Exit


Very difficult decision today at the Wheat market Close.There were reasons to exit and reasons to hold.

The top chart is the Daily chart after the Close. We formed a Bullish Harami candlestick pattern and closed over the 3ema. The 3ema is like a proxy for the 8ema when price is far from the 8ema. Also, we bounced off the previous swing low from mid-December. If we get continuation in the next couple days we will most likely lose all our profit and could feasibly hit our Stop for a loss.

However, we're still under the 8ema, and should therefore hold the position and see what happens tomorrow. Stochastics are low but not very oversold. Also, The BB/KC break out to the downside is just beginning. Not to mention all the Bearish indications that got us into this trade.

So, I zoomed into the 15 minute chart, which is the 2nd chart above, to get more perspective. You can see price is up against resistance from both the 200sma and the 61.8% Fibonacci retracement level. Stochastics are significantly overbought. These suggest price is likely to reject this level and take a dive back down. But it didn't. It didn't break through to the upside either. It just got lodged between the 8ema and the resistance level. Now look at the volume. A huge spike in the last 15 minutes. Since price barely moved in that volume spike, it shows there was a big battle between the bulls and the bears. So the market couldn't decide either, and I wasn't getting any clearer message from the 15 minute chart.

What else could I do to get some insight? I looked at the other grain charts:


The upper chart is the March Corn Daily, and the lower chart is the March Soybean Daily. These looked like they were likely to continue upward for days. Look at Soybeans. It made a new high and closed near the top of the candle!

Looking at these convinced me we needed to exit our Bearish position today, capture what profits we were fortunate to still have, and monitor the March Wheat chart going forward to see if we should re-enter short.

I Tweeted at 13:57 ET:

"I may exit our Short March Wheat Futures position before the 14:20 ET Close today. Watching the 15 minute chart, which is at a critical level."

At 14:11 I Tweeted:

"I'm out of the Short March Wheat Futures position at 770. Details after the Close."

Bottom line:

Shorted: 790 12/29/21
Covered: 770 1/4/22

Profit: 20 points * $10/pt (YW mini-contract) = $200 (Full size would be 20 * $50 = $1,000)

Monday, January 3, 2022

March Wheat did an about-face - Update 3


Very good day for our short Wheat trade. On the Daily chart above you can see:

  • We set a lower high and a lower low.
  • We went lower on increased volume.
  • You can see the bottom BB has separated lower than than the KC.
  • Each of the last 3 candles have bigger bodies, showing an acceleration.
  • Stochastics are not yet oversold.
All of the above are constructive for our short thesis. However, we are very close to previous support at 751. Tomorrow will be very important to see if we breeze by the previous swing low, or react to it and get a pop. This made me want to cash out our current profits today, which are relatively attractive. But that could be a big mistake if price continues its cascading drop off.

Another thing that made me want to take profits was Soybeans. Corn continued to look Bearish but Soybeans did a Doji Gap Up off the 8ema on high volume, which is quite Bullish. This gives me concern, but we have to remember while each of these grains are in the same commodity class, they are also different markets.

Just the fact that I'm looking at a nice profit that I don't want to lose is enough pressure to want to exit. But that's to be expected and a trader must be able to deal with that emotion, or they're doomed to keep leaving more money on the table than they should.

So, at the market close, I had to suck up my fears and go with the odds, which is to leave the position on.

However, I think the 729 target might be a little low. The D point of the white AB=CD is 730.50, and the 200sma has risen to 728.93. So, I raised the Target to 732.


Friday, December 31, 2021

March Wheat did an about-face - Update 2


We had a gorgeous day for our short position, even though we had relatively low volume due to it being New Year's Eve day. We closed with a lower high and a lower low than yesterday. We also closed under the previous Support/Resistance level that provided support for the past 2 candles, but not today.

And Stochastics are still in the mid-range while the BB/KC Squeeze is about to break out. Things are looking very constructive as of today's Close.

Corn also closed with bearish indications, which lends some indirect support to a short position in Wheat.

There are only 2 grain related USDA reports due out next week. They are both at 3pm ET on Monday 1/3/2022:

  • Fats & Oils: Oilseed Crushings, Production, Consumption and Stocks
  • Grain Crushings and Co-Products Production

I'm told by respected Ag trader Richard Anderson that usually neither are market moving reports. So, I'll be holding our position through the news release. You can see the schedule here:


If you noticed in yesterday's post I was also short Soybeans, I covered that position at the close today at 1340. Net is 1364 1/2 - 1340 = 24 1/5 points * $10/pt = $245 in the Soybean trade. The full contract would have been 24.5 * $50/pt = $1,225.

I closed it because:

  • I'm over-weighted short grains to hold over the weekend.
  • March Soybeans could not close below the 8ema yesterday or today.
  • Taking the profit is a hedge against Wheat gapping up at the next market open.

Nothing to do now but wait until next year :)

Thursday, December 30, 2021

March Wheat did an about-face - Update 1


We got a nice confirmation of our short thesis on the zoomed in Daily chart above. If you want to see a wider view, look at yesterday's post.

We had a little gap up at the open then formed a Bearish Engulfing candlestick pattern. Stochastics are not yet oversold, but we didn't make a lower low compared to yesterday, and the BB/KC hasn't broken out yet.

We also got some encouragement from the Corn and Soybean daily charts. (I'm also short March Soybeans as of yesterday from 1364 1/2, but I'm not blogging about it because I got in way too early.)

Our short is looking good and I held the position, but I'm not feeling confident yet. It doesn't help that tomorrow is New Year's Eve day, which makes things a little weird, including possible tax related sales by traders and expected light volume.

Wednesday, December 29, 2021

March Wheat did an about-face


Above is today's Daily chart of March Wheat futures right after the grains market closed. Just before the Close I shorted a YW mini-Futures contract at 790. The mini-contract is $10/pt, while the full size contract is $50/pt.

In the previous Wheat trade on this blog I wanted to go long due to a Gartley pattern. That Bullish pattern has not yet been violated, so this is a bit of a contradictory situation. However, my Target for this Bearish trade is above the X point of the Gartley pattern, so both trades can work.

Here is what I saw that caused me to go short today right before the market Close:

  • Head & Shoulders
  • Bearish engulfing candlestick pattern
  • Continuation by the next candle
  • Close below the 8ema, 20sma, and 50sma
  • Close below the H&S Neckline
  • Possible Bollinger Band/Keltner Channel Squeeze
  • Possible AB/CD (light blue angled lines)
However, I also see we had support from a previous Support/Resistance level, and we formed a Bullish Harami candlestick pattern. Today we formed a Doji candle which represents indecision.

We could turn right around and head back up from here to hit the Gartley .618AD Target, and we haven't yet confirmed an AB/CD by dropping lower than the B point at about 750.

So, I don't have a lot of confidence in this Bearish trade yet, but there are enough indications where it makes sense to enter the trade, albeit lightly.

I set the Stop at 801. I picked 801 rather than 800 because 800 is a round number. It's just above the H&S Neckline, 8ema, 20sma, and 50sma. It's a bit of a tight Stop, but this is not yet a high probability setup. And if we break through all that resistance, then the downward momentum that got us where we are can't be very strong. So stopping out early might be a good thing.

I set the Target near the 727.643 78.6% Fibonacci level of the yellow range, which coincides with the 200sma, the measured move of the white AB/CD, and shades the light blue AB/CD and the full measured move of the Head & Shoulders.

Summary:

Entered: 790
Stop: 801
Target: 729

Risk: 801 - 790 = 11 points
Reward: 790 - 729 = 61 points
R:R = 61/11 = 1:5.5 which is ridiculously good.


Thursday, December 23, 2021

Wheat Marching to a Reversal - Exit


Above is Yesterday's  March Wheat futures Daily chart. Yesterday, 12/22/21 at 8:47am ET, I Tweeted:

"Well, the Mar Wheat Futures setup is finally ready to trade, but the Risk:Reward is bad. So, have to pass :("

Sometimes being diligent will cost you entry to a trade. There's an old saying I like "I'd rather be out wishing I was in, than in and wishing I was out".

If I waited for confirmation and then entered, it probably would have been around 805. If I did, I would have set the Stop to 750, just below the D point at 751. The Target would be 827, which is the 61.8% Fibonacci based on a Gartley pattern with the D point at 751. You can see the targets listed on the chart.

The Risk:Reward would have been:

Risk: Entry - Stop = 805 - 750 = 55
Reward: Target - Entry = 827 - 805 = 22
R:R = 2.5:1 which is the opposite of what you want, and way to bad to trade. In addition, A risk of 55 on a mini-contract of $10/pt would be $550, which is a little too high.

So, unfortunately, I'm sitting this trade out and keeping my capital dry for the next trade.


Tuesday, December 21, 2021

Wheat Marching to a Reversal - Update 1


The previous post showed we were waiting for price to get down to 740 for a long entry. We got down as low as 751, so our order never triggered.

Now, we had a bullish looking day today. We closed over the 8ema, 34ema, and 50sma. We closed over the Head and Shoulders neckline, and closed at the top of the candle. You could also argue we formed a double doji sandwich candlestick pattern, which is bullish. Also, 3 trading days ago we bounced off the 61.8% Fibonacci retracement in the yellow range. However, we haven't yet closed over the 20sma, or even penetrated it.

Do we abandon our thesis that price is coming down to the 740 area because of all the bullish indications above? I'd say not yet. I'd like to see confirmation in the form of a close over the 20sma with Stochastics not in the overbought condition. If we get this tomorrow, then we'd have to conclude we reversed the recent down trend and have entered an up leg, which would rejoin the longer term up trend.


Thursday, December 16, 2021

Wheat Marching to a Reversal


The Wheat March Daily chart above looks very busy but its a really cool setup and I'll explain the whole thing. I'll explain the different elements of the setup then pull everything together at the end.

Let's start on the left and work our way right. The big, thick, white, angled, lines represent an AB/CD pattern. The calculated top of the pattern is 856.75 (see calculation on the chart), but the actual top was 874.75. This range is also shown by the large, vertical, green, downward pointing arrow.

The anticipated retracement of the green range is 50%,  61.8% or 78.6%. The box with green text on the chart has the calculations. 50% is 750.75, and 61.8% is 721.5%. Yesterday's candle low was 751, which is only a quarter point shy. You could certainly argue today's bounce was a rejection off the 50% Fib of the green range. If we say we hit the 50% Fibonacci of the green range, and price goes lower, then the next expected move is to the 61.8% Fib.

The yellow range is a possible Gartley (aka XABCD) pattern setting up. The X, A, B, and C points are labeled in white. The D point hasn't been determined yet. The shorter, thick, white, angled, lines represent the AB/CD pattern within the Gartley, and the bottom end of the line on the right is the calculated D point. You can see the calculation in the box with white text. The result is 730.5.

The candle low yesterday and today is finding support at the 61.8% Fib of the yellow range, which is 759. You could certainly argue today's bounce was a rejection off the 61.8% Fib of the yellow range. If we say we hit the 61.8% Fibonacci of the yellow range, and price goes lower, then the next expected move is to the 78.6% Fib.

The purple lines represent a Head & Shoulders pattern. You can see the traditional measured move by the purple vertical line dropping down from the neckline. But, in my experience, the better target is half the measured move. That's represented on the chart with a thin, purple, horizontal line at about 739.

The white, thick, rising, squiggly line near the bottom is the 200sma. It's currently about 721. It's rising at a rate such that it'll easily surpass 721.5 by the time price comes down to it, if price drops that far before reversing. I mention 721.5 because that's the 61.8% retracement of the green range, which is the lowest target.

Stochastics are in the bottom panel of the chart and are only barely in the oversold zone. This tells me it would not be surprising to see lower price from here.

OK, I think we hit all the elements of the chart that warrant consideration. Now I want to tie everything together. Basically, I think we're going a little lower then reversing and heading back up. Here's why:

  • The large AB/CD has an expected target of 61.8% Fibonacci retracement of the green range, which is 721.5.
  • The AB/CD of the Gartley pattern has an expected target of 730.5.
  • There's expected support at the 78.6% Fibonacci level of the yellow range at 727.643.
  • The Head & Shoulders has an expected target of 739.
  • There is expected support at the 200sma, which is currently 721 and rising.

The highest of these possible bottoms of the current down leg is 739, and the lowest is 721.5. To be conservative, I want to enter a Long position at 740, which shades the 739 level by a point to account for slippage from the Bid/Ask spread and imperfect patterns.

The proper location for a Stop on the Gartley would be just under the X point, which is 687.75. However, even with the mini-wheat futures contract at $10/pt, the risk is a little too high. The risk would be 740 - 687 = 53 points * $10/pt = $530.

To reduce the risk amount, I think we can place the Stop 710. This gives us over a 10 point cushion from the lowest expected reversal point of 721.5. The amount of the risk with this Stop would be 740 - 710 = 30 * $10/pt = $300, which is a more tolerable number.

Using the Gartley pattern to determine a Target, gives us 819.65. This is .618AD, where D is the value at AB=CD, which is 730.5. We'll have to adjust the Target when we have an actual Gartley D point.

So, bottom line is, I entered a conditional order this afternoon to buy a March Wheat mini-contract (YW) with a limit of 740, Stop 710, and Target 818. (818 shades the 819.65 exact Target to account for slippage).

Risk: 740 - 710 = 30 * $10/pt = $300
Reward: 818 - 740 = 78 * $10/pt = $780
R:R = 780/300 = 2.6:1 which is excellent. Especially when considering the Gartley has about a 75% win rate.


Friday, November 12, 2021

Christmas Wheat Reversing on Ag News - Exit


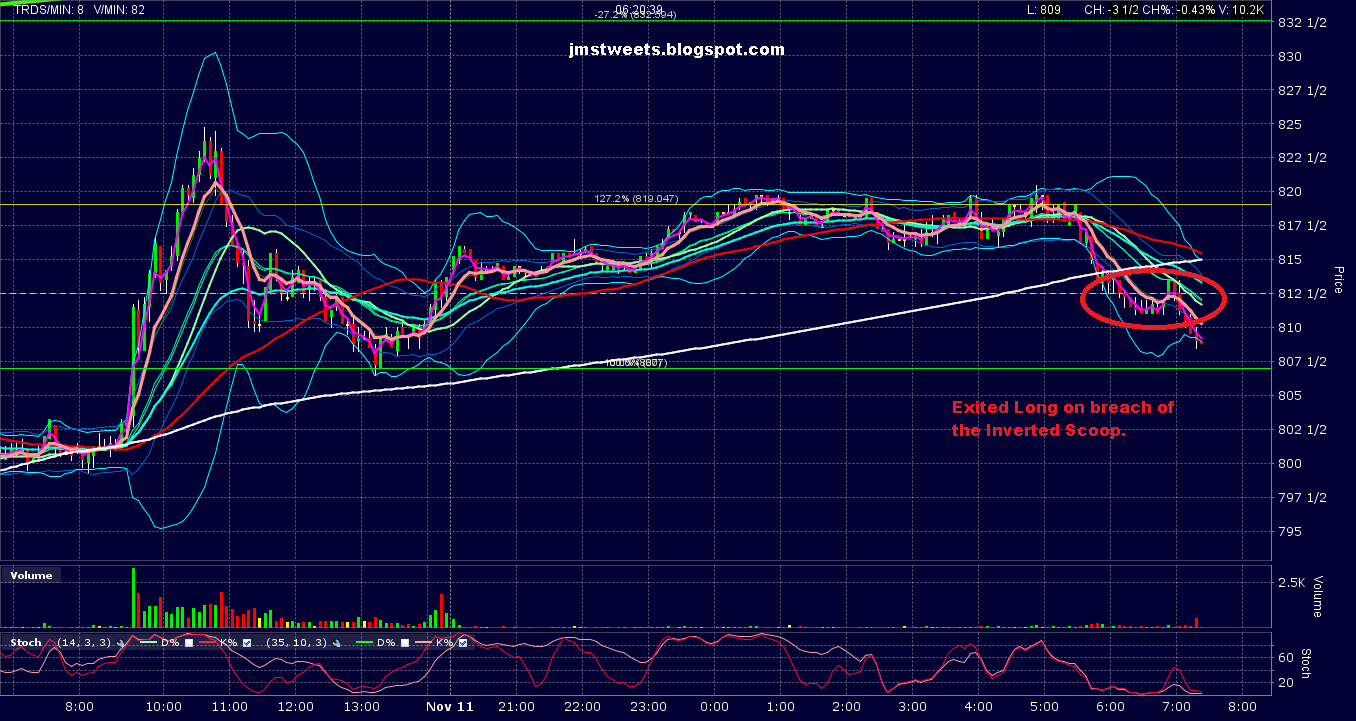
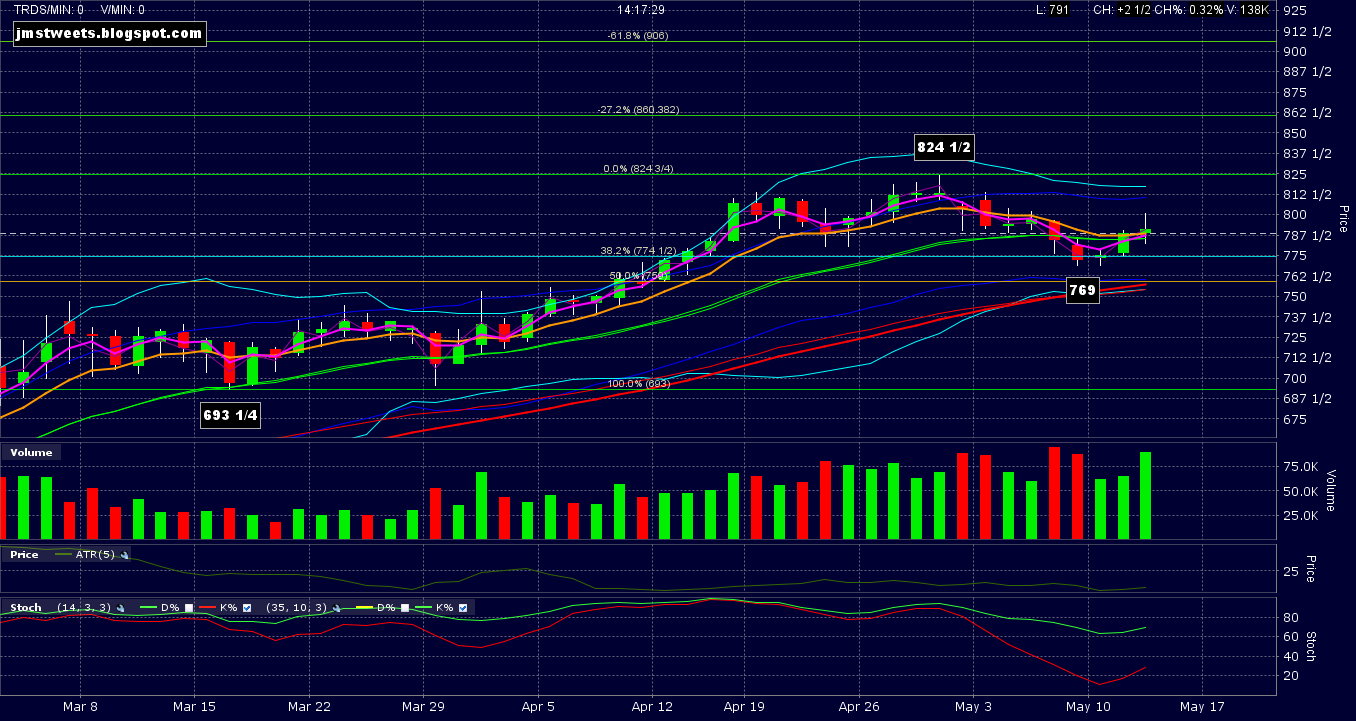
This morning 7:26am ET I Tweeted that I exited the trade at 810 1/8 based on an Inverted Scoop pattern on the 5 minute chart. See the top chart above. As you know from the other posts in this thread, I was looking to get out today by the Close due to a wheat related report that was scheduled for release after the grains market closed.

In the morning, price was heading down and looking serious about it. I was watching the paper profits dwindling away, not knowing or having any indication whether we would continue down all day. So I went down to the 5 minute chart and watched for a pattern or some indication about where the market was headed for the rest of the day.

Then I saw an Inverted Scoop pattern develop and trigger to the down side. See the red oval on the top chart above. So, the most reasonable thing to do was exit before more damage was done.

Of course, after the 9:30am ET Open, price started back up and hit a high of 826 3/4, which is about 5 points away from our Target of 832. See the bottom Daily chart above. That Target may well be hit the first day of trading next week. I thought about chasing wheat back up today, but that could have turned out badly and erased the profit we already realized. I decided to go trade other things.

All in all, can't complain about this trade. Price behaved exactly as anticipated overall and we made a good profit. Of course, I wish price had moved a little faster and there was no Ag report today. But a perfect trade is rare.

Summary:

Entry: 780 5/8, 11/9/21
Exit: 810 1/8, 11/12/21
Profit: 810 1/8 - 780 5/8 = 29.5 points * $10/pt = $295.

If we used the full size contract, profit would have been 29.5 * $50/pt = $1,475.

Thursday, November 11, 2021

Christmas Wheat Reversing on Ag News - Update 2


Another good day for our long position. In fact, today's high was 824 3/4, which is getting close to our target of 832.

At 10:03am ET this morning, I Tweeted that we moved our Stop to break even at 782. We're at a point now, that if we fall that far, something is curiously wrong, and we'll probably want to be out of this trade.

Today's high was stretched out pretty far from the 8ema, and even from the 3ema. That, plus possible resistance from the 127.2% Fibonacci extension of the yellow range, made the pull back to about the halfway point of today's candle, unsurprising. 

We got a nice volume spike today after yesterday's increase in volume, which may indicate Dec Wheat is getting increasing attention. If the attention is coming predominantly from Bulls, then that's a good thing. The fact we closed in the middle of today's candle tells us the Bears aren't yet dominating, and this uptrend is most likely not yet over.

As I mentioned in yesterday's post, I want to be out of this trade before the close tomorrow at 14:20. So, I entered a conditional order to sell our position at 14:14:14 tomorrow, Friday (just having some fun with the time). It would be preferable if we exit due to hitting our target rather than timing out. If we get another  green candle of today's size, or yesterday's size, or even Tuesday's size, we'll hit our target. That's the goal.

Wednesday, November 10, 2021

Christmas Wheat Reversing on Ag News - Update 1


Great day in the wheat fields. We created a bigger candle than yesterday on higher volume with a close very close to the high of the day.

When looking at the chart, please focus on the green annotations and the yellow Fibonacci range on the right side of the chart.

Stochastics are not yet overbought, so no pressure there. We gapped up on the open but filled the gap in, so no pressure to fill the gap.

If we exceed the previous swing high at 807, then we may attract break out and momentum traders, which will add a tail wind to our long position.

I thought about moving our Stop to break even but it would be too close to the 8ema, and our original Stop. I'd hate to have a temporary pull back overnight, hit break even, then take off to the upside. Its happened to me plenty of times in the past. So I didn't move the Stop yet.

I'm concerned about a possible rejection off the previous swing high at 807, which could create a Double Top. But, judging from the strength we're seeing, I think the odds are that we'll breach the 807 level with a mild to no reaction, then continue for a higher close on the day tomorrow.

There's a monthly report named "Wheat Outlook: November 2021" due out this Friday 11/12/21 at 15:00 ET. I don't have any intelligence on how likely this report is to move the market, so I'm thinking I want to exit this position by Friday's 14:20 close. This would avoid the risk of the report as well as weekend risk.

Bottom line; we're looking good at the moment.

Tuesday, November 9, 2021

Christmas Wheat Reversing on Ag News


Agricultural reports today were bullish for wheat. By the end of the day for grain futures, 14:20 ET, I observed the forming of a Morning Star candlestick pattern and a close over the 8ema. This was on substantial volume in a general up trend. 

When looking at the chart, focus on the green annotations and the yellow Fibonacci range on the right side of the chart.

I see 3 good candidates for targets:

  • Confluence of the 27.2% Fibonacci of the green range (832.59) and the 161.8% extension of the yellow range (834.5). 
  • AB=CD (856.75)
  • 61.8% Fibonacci extension of the green range (865.25).

Starting with the most conservative target of 832. Using a Stop just under the swing low we just made. Specifically 761.

Summary:

Entry: 780 5/8
Stop: 761
Target: 832

Risk: 761 - 780 5/8 = -19.625
Reward: 832 - 780 5/8 = 51.375
R:R = 51.375/19.625 = 1:2.6, which is great.


Friday, October 1, 2021

Dec Wheat Bullish Gartley Re-entry - Exit


Target hit! I posted yesterday "My expectation though, is to cut right through it." with regard to the previous consolidation level. This was because we already bounced off it once and came right back, plus we were looking strong after the Ag report came out yesterday. Well, take a look at the Daily chart above. Please just focus on the yellow annotations, and of course, the candles. I think that qualifies as "cutting right through it".

So we hit our 744 target and then some, and its currently only 12:12pm ET as I write this. There's enough time to continue up to the 763 .786AD secondary target, but I'm not trading that one. These Gartley patterns are terrific!

Summary:

Entry 725 3/4
Exit 744
Profit 744 - 725 3/4 = 18 1/4 * $10/pt = $182.50 
If we used the ZW full sized contract: Profit 744 - 725 3/4 = 18 1/4 * $50/pt = $912.50

We've had 3 actual trades within this Gartley pattern since this thread began. Here is the net:

9/20/21 -$120
9/24/21 +$183.75
10/1/21 +$182.50
Net +$246.25 profit. 
If we used the full sized ZW contract it would have been $246.25 * 5 = +$1,231.25

Thursday, September 30, 2021

Dec Wheat Bullish Gartley Re-entry - Update 3


Today we got the "Grain Stocks" report. I discussed this in the previous post and a Tweet I sent out this morning at 8:47am ET:

"Big Grains report named "Grain Stocks" coming out 12:00pm ET. Could move ZC_F Corn, ZS_F  Soybeans, ZW_F Wheat markets. Be careful."

Now that we can see the report had a bullish effect on Wheat, we got back in right before the market close at 14:20 ET. Got a YW Futures mini-contract for 725 3/4.

See the Daily chart above. Again, I apologize for how busy the chart is. Just focus on the yellow annotations.

Notice we have a good size green bar on high volume. Had a little bit if a "Doji gap up" and a kind of a Morning Star pattern, but neither pattern is very well formed. We closed above all Moving Averages and made a new high since the D point swing low. The Bollinger Bands and Keltner Channel are beginning to blossom outward. Stochastics are still innocuous in the mid-range. All this is constructive for completion of our Bullish Gartley pattern. I consider completion to be the .618AD point.

However, you can see today's high is right on the double parallel thin white lines, which represented a gap on a much older trade on a much lower time-frame. But now it also represents the heart of the multi-week congestion. This could cause us trouble by providing some resistance. My expectation though, is to cut right through it.

Continuing with our original target of 744 at the Gartley .618AD retracement on the Daily chart. Using a Stop just under today's Open of 711 1/4, at 710.

Summary of our 3rd trade in this daily Gartley pattern:

Entry: 725 3/4
Stop: 710
Target: 744

Risk: 725 3/4 - 710 = 15 3/4
Reward: 744 - 725 3/4 = 18 1/4
R:R = 18.25/15.75 = 1.16:1, not good but acceptable for this high probability setup.

Friday, September 24, 2021

Dec Wheat Bullish Gartley Re-entry - Update 2


Decided to exit the position for the weekend, and capture some profits while avoiding headline risk in a volatile market.

I suspect we'll get a pull back before hitting our target at 744. We're completing an AB/CD pattern, which is expected to offer some resistance. The precise D point is 728 3/4 with the calculation shown on the chart. In addition, a little higher than that, there's a swing high at 733 1/4 (see the thin white parallel lines) which also offer resistance. That swing high is right in the middle of substantial congestion in the recent past  (again, see the thin white parallel lines).

If we got a pull back early next week, it'll be problematic because there's a market sensitive Ag report due out Thu 9/30/21 named the "Grain Stocks" report. We'd want to be out of the market before that report hits. We may be significantly lower than where we are now if we get a pull back before the report.
(https://usda.library.cornell.edu/concern/publications/xg94hp534)

So, I think the best strategy is to take our profits, avoid any bearish news over the weekend when the markets are closed, wait for a pull back due to the resistance I described, then get back in after the Ag report for the ride back up to our target. We already did exit and re-enter once, which turned out to be a good decision.

The chart is still quite Bullish. We made a higher low and a higher high then closed over the 50sma, which was a possible source of resistance, but wasn't. Stochastics are still mid-range, so no pressure from being overbought. Today had higher volume than the past two days. Given a chance to get back in this Gartley pattern with a good entry, I certainly would.

Summary for this part of the trade:

Enter 705
Exit 723 3/8
Profit $183.75

Thursday, September 23, 2021

Dec Wheat Bullish Gartley Re-entry - Update 1


The Daily chart above shows we gapped up at the open last night, then filled in the gap, followed by a nice up day. Sorry its so busy. Please just pay attention to the yellow annotations.

We finished at the top of the candle, and made a higher high than the previous swing high. We closed over the 8ema and also over the 20sma and 34ema. Stochastics are still mid-range, so plenty of runway. Volume was higher today than yesterday, which adds credibility to today's move. All is is Bullish.

I wanted to add to my position but we're up against the 50sma which can provide resistance. So I'm going to wait on that. Tomorrow is a Friday so I probably won't increase the position tomorrow either.


Wednesday, September 22, 2021

Dec Wheat Bullish Gartley Re-entry


Decided its a good time to get back in long on the Dec Wheat Futures. At 13:36 ET today I sent the following Tweet:

"Back in long December Wheat Futures 13:27 ET, but I'm early. Should wait until today's close. Entry 705, Stop 685, Target 744. Details later."

So now, at the 14:20 ET close of the grains futures markets, I can see I would have made the same decision at the close as I did at 13:27, which was too early. I got in then because the chart looked like price was starting to run in front of the FOMC announcement at 14:00 ET. We were over the 8ema at the time and the risk/reward is so good that I wanted to get in before a potential pop from the FOMC news.

The chart above is a Daily chart. Just focus on the yellow annotations. It shows:

  • We closed above the 8ema.
  • We formed a Bullish Engulfing candlestick pattern.
  • We formed a higher swing low.
  • We're still in a Bullish Gartley pattern.
  • We already bounced off the Moving Average resistance above us.
    • This suggests this time we can cut through it.
Also, there are no significant wheat related USDA reports until the 9/30/21 Grain Stocks report.

The 685 Stop is just under the recent swing low. The 744 Target is the .618AD Fibonacci retracement, shaded a little bit from 744.671 to account for slippage and Bid/Ask spread.

Summary:

Entry 705
Stop 685
Target 744

Risk 685 - 705 = 20
Reward 744 - 705 = 39
R:R = 39/20 = 1.95:1 which is good.