Showing posts with label DBX. Show all posts

Friday, February 19, 2021

DBX AB/CD - Exit


See how yesterday's candle was a green candle and today's candle gapped down at the open and closed with a red candle? That's known as a "Bearish Kicker" candlestick pattern and is a very bearish signal. We did bounce off the 50sma and might continue up next week, but closing below the 8ema and the 20sma after a Kicker signal left no choice but to exit this trade.

Summary,

2.47-2.96=-$49. from yesterday's post.

Feb 26th 25 Call .25-1.26=-$101

Net loss -$150.


Thursday, February 18, 2021

DBX AB/CD - Update 8


The top image is from earningswhisper.com showing DBX expectation was $.24 EPS with an actual of $.28 EPS. .04/.24=17% beat. $.04 seems mild but it should allow our Bullish setup to continue, unless management says something bearish.

The top chart in the middle is a 1 minute chart showing the reaction to the ER release. The bottom chart is a wider view of the whole setup.

At about 15:45, before the ER release, I decided to sell the Apr 25 Call for $2.47 and buy a Feb 26th 25 Call for $1.26. This cut my risk in half, and if we got a positive report (which we now know we did), then the much higher Gamma will give us more profit if the move is big enough such that the higher Gamma will overcome the higher Theta.

Doing this resulted in a small loss on the April option:

2.47-2.96=-$49.

Keeping the target the same at $29. 

Now that we know the ER turned out well, I may buy a longer dated option when we sell the Feb 26th option, if we haven't hit the target yet and the risk/reward makes sense.


Wednesday, February 17, 2021

DBX AB/CD - Update 7


Well, the Quarterly Earnings Report is due out tomorrow after the market close. Today we closed right on the 8ema. I think today and tomorrow, and maybe yesterday, we're just going to consolidate until the Report. So Technical Analysis probably doesn't even matter.

At this point the big question is whether to hold the position over the Earnings Report. There are 3 possible cases. Earnings exceed expectations, a "beat". Earnings fall short of expectations, a "miss". Or, Earnings are close to expectations.

If we get a beat, and the stock takes off to the upside, then the greater daily pattern will be a J-Hook if you include the previous up leg, or a Cup & Handle if you just look at the recent dip since Christmas.

If we get a miss, and the stock takes a dive, then we have a Double Top formation on the Daily chart. 

If the Report meets expectations, then the previous pattern should continue on, which has been Bullish.

Normally, I don't like holding over ER's because they are a crap shoot. There is a method to calculate a statistical expectation. You look through the history of ER's and simply count the number of each of the 3 possibilities and calculate the percentages. I'm not sure if that actually gives you an edge or not.

However, in this case, we have a very bullish technical setup, which you can argue is an indication the market believes we won't get a miss. Two out of the three possible outcomes are bullish. Also, if you look at the price range the past 4 months have covered, its like 18 - 25, which doesn't look very dangerous. In addition, our position is in long options, which have a fixed maximum loss equal to the cost of the options.

So, given the specific circumstances of this particular trade, I'm leaning towards holding the position over the Earnings Report tomorrow after the market close. I'll decide near the Close tomorrow, after having seen the day's price action.


Tuesday, February 16, 2021

DBX AB/CD - Update 6


Today doesn't look pretty but the bullish setup is intact. We gapped up at the Open, which is Bullish, then we retested the 8ema and retraced back up by about half, closing (24.49) very close to the previous Close (24.51).

We're beginning to form the J-hook pattern we were planning on, so all in all not a bad day.


Friday, February 12, 2021

DBX AB/CD - Update 5


Looks like patience and tolerance paid off. We're looking much better with a nice sized green candle and a close above the 8ema. Stochs have been brought down to the mid-range, so lots of runway for next week.


Thursday, February 11, 2021

DBX AB/CD - Update 4


Well, I'm pushing out of the comfort zone a bit at the Close today. You can see we're closing a little under the 8ema. Technically, I should exit the position, but I think we're close enough to the 8ema to give it a chance to recover tomorrow and go back up. If we don't, we'll have to exit and watch for an opportunity to get back in.

If you look left you'll see 4 peaks followed by a swoon back down, then a recovery to the upside. We're in the swoon after the 4th peak. Since this peak is at the same level as the first peak, I expect a little extra volatility, which will result in a Cup and Handle pattern. This will probably mean we'll need to exit tomorrow. But the good news is we may be able to re-enter our long position from a lower price, and thereby give us a better Risk/Reward ratio and ultimately an opportunity for greater profits.


Wednesday, February 10, 2021

DBX AB/CD - Update 3


The best part of today was the open. We gapped up by 24.78(today's open) - 24.15(yesterday close) = 0.63, which is .63/24.15 = 2.6%. That's significant. Which may be why longs could have taken some profits. Of course, I don't know if either is true, but a nice gap up is certainly a Bullish indication.

We closed the day right on the 8ema and not under the 8ema. So, based on that, I don't see a good reason to exit. We'll see what happens tomorrow.


Tuesday, February 9, 2021

DBX AB/CD - Update 2


Yesterday I wrote "Because we're at the previous swing high, it's common to find some resistance. So we may take a little dip this week and test the 8ema.". That's exactly what we saw today.

We opened a little higher this morning then dropped downward, but we closed above the 8ema. In fact, we didn't even touch it.

However, while we didn't form an official candle pattern, its similar to an Evening Star, and stochastics are high. Also, the ADX flattened out (see the middle subchart purple line). So we do have reason to be cautious. 

If we continue down and close below the 8ema, this chart will look like a Double Top may be forming. Meanwhile, we need to hold our position.

Monday, February 8, 2021

DBX AB/CD - Update 1


Today we gapped up. rose further, then came back down to fill the opening gap, and closed near yesterday's close. We also broke through the previous swing high at 25.16 but have yet to close over it.

Because we're at the previous swing high, it's common to find some resistance. So we may take a little dip this week and test the 8ema.

Certainly looking bullish enough to hold the long position. All of our bullish indications are still intact.


Friday, February 5, 2021

DBX AB/CD


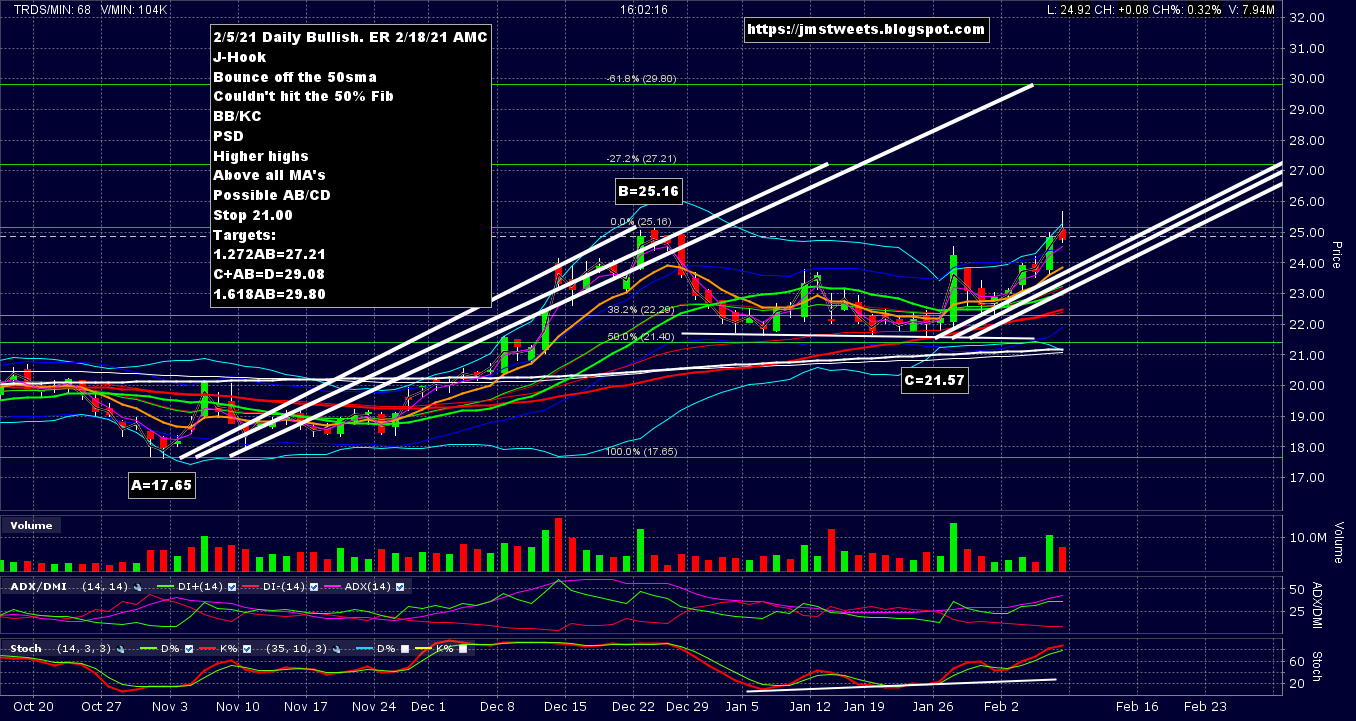
Dropbox (DBX) has its Quarterly Earnings Report in a couple weeks on 2/18/21 after market. That gives us 8 more daily candles (Equity markets are closed Mon 2/15/21 for President's Day). We only need 4 more candles of today's size to hit the D point of the AB/CD pattern.

I plan to exit before the Earnings Report even though its a Bullish chart. These reports are too much of a crap shoot without some kind of edge other than the current chart. There are strategies for trading Earnings Reports, but I only tested one of them and it didn't work. There is another one I'd like to test but haven't yet.

The top chart is a wider view of the Daily chart to include the AB/CD projections for 1:1, 1:1.272, and 1:1.618. The second chart is a close up of the Daily to see better detail of the recent price action.

I see a number of Bullish indications:

  • J-Hook candle pattern
  • Bounce off the 50sma
  • Couldn't hit the 50% Fib on AB
  • Bollinger Bands/Keltner Channel Breakout
  • Positive Stochastics Divergence
  • Higher highs
  • Above all Moving Averages
  • Possible AB/CD pattern
Got DBX Apr 25 Call at $2.96 when DBX was 24.94. I Tweeted earlier today that I was going long on DBX and posted a chart.

Stop = 21.00 just under C point.

Targets:
1.272AB=27.21
C+AB=D=29.08
1.618AB=29.80

Shooting for the 29.08 target. Using the stock price for risk/reward calculation:

Risk: 24.94-21.00=3.94
Reward: 29.08-24.94=4.14
R:R=1:1.05 no where near 1:2 but it appears to be a high probability trade.