Showing posts with label Scoop Pattern. Show all posts

Tuesday, November 29, 2022

Bullish Jan 2023 Beans

Jan 2023 Soybeans Daily Chart

Went long January Soybeans with a Jan 1450/1460 Call Spread for 5 1/8. Multiplier is $50/pt, so cost was 5 1/8 * $50/pt = $256.25. Today's bean close was 1459 1/2, which means our Call spread is very close to 100% intrinsic value. If the futures price stays over 1460, we'll see the valuation of the option spread widen out from 5 1/8 to 10, which would double our investment. It'll widen out because the time value of the long option will wane as we get closer to expiration on 12/23/2022.

See the yellow annotations on the chart above.

Went long because I see:

  • Flag pattern break out.
  • Scoop pattern about to break out.
  • Bollinger Band/Keltner Channel squeeze about to break out.
  • Left/Right Combo candlestick pattern.
  • Close above the 8ema, with continuation today.
  • High up volume.
  • Above all Moving Averages.
  • No Grain Reports for at least 1 week.
Soon as the order was filled, which was 14:18 ET, 2 minutes before the grain futures market closed, I entered a sell order for 9 3/4.

The expected bullish move of the Jan Soybean futures price is the D point of the AB=CD pattern (see thick yellow angled lines). D can be calculated from 1406.75 + (1469 - 1366.75) = 1509. This is very close to, but just shy of, the previous swing high of 1512.25.

Summary:

Entry: 1459.
Target: 1509.
Stop: not necessary because our risk is fixed and affordable, thanks to the option spread.
Risk: 256.25
Reward: (9 3/4 - 5 1/8) * 50 = 231.25
R:R = 1:1 which doesn't sound great but expect this a high probability setup.

Friday, November 12, 2021

Christmas Wheat Reversing on Ag News - Exit


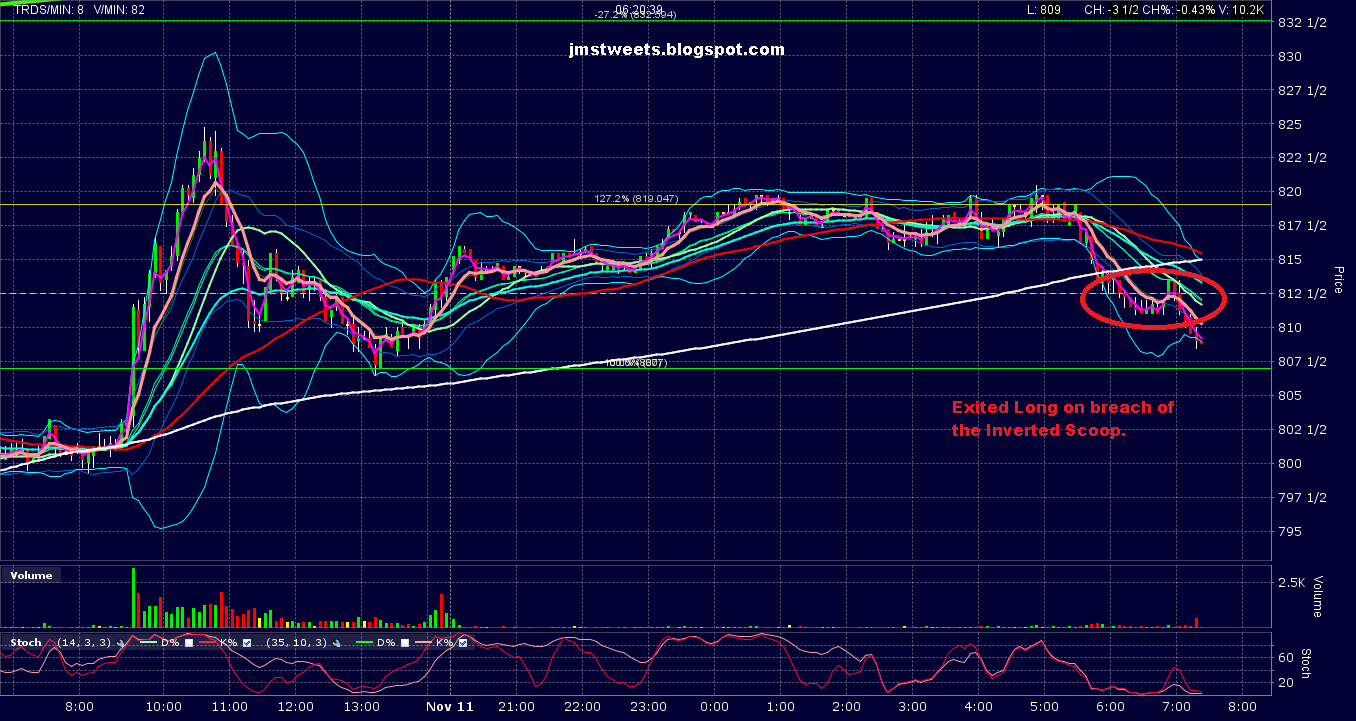
This morning 7:26am ET I Tweeted that I exited the trade at 810 1/8 based on an Inverted Scoop pattern on the 5 minute chart. See the top chart above. As you know from the other posts in this thread, I was looking to get out today by the Close due to a wheat related report that was scheduled for release after the grains market closed.

In the morning, price was heading down and looking serious about it. I was watching the paper profits dwindling away, not knowing or having any indication whether we would continue down all day. So I went down to the 5 minute chart and watched for a pattern or some indication about where the market was headed for the rest of the day.

Then I saw an Inverted Scoop pattern develop and trigger to the down side. See the red oval on the top chart above. So, the most reasonable thing to do was exit before more damage was done.

Of course, after the 9:30am ET Open, price started back up and hit a high of 826 3/4, which is about 5 points away from our Target of 832. See the bottom Daily chart above. That Target may well be hit the first day of trading next week. I thought about chasing wheat back up today, but that could have turned out badly and erased the profit we already realized. I decided to go trade other things.

All in all, can't complain about this trade. Price behaved exactly as anticipated overall and we made a good profit. Of course, I wish price had moved a little faster and there was no Ag report today. But a perfect trade is rare.

Summary:

Entry: 780 5/8, 11/9/21
Exit: 810 1/8, 11/12/21
Profit: 810 1/8 - 780 5/8 = 29.5 points * $10/pt = $295.

If we used the full size contract, profit would have been 29.5 * $50/pt = $1,475.