 |
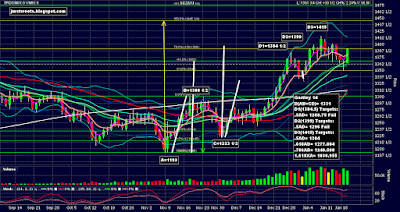
| Jan Soybeans Daily |
 |
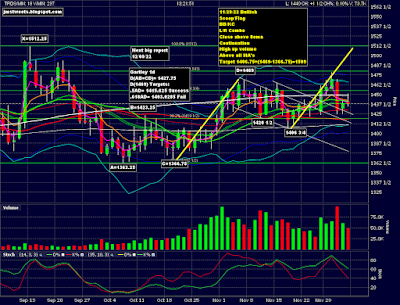
| Jan Soybeans 5min |
As you can see on the 5 minute chart above, we drifted upward overnight until the US Service PMI Report was released at 10am ET. The numbers were hotter than expected, which the market interpreted as more Quantitative Tightening by the Federal Reserve, which tanked almost every market, including Soybeans.
However, at the end of the day, the 5 minute chart shows we formed a double bottom and tried to climb higher into the Close. But the Daily chart above shows we bounced off the 200dma and closed under the 8ema, with Stochastics in the mid-range. It looks like we may just go sideways until this Friday 12/9/22 when there's a big Agricultural report at 12:00pm ET.
Unfortunately, sideways price action actually seems the most likely, given the circumstances. If we accept that, then the question is do we sell and limit our losses, or thanks to our fixed maximum loss due to using an option spread, hold our position through the report?
Let's review our Risk:Reward. Even though the Soybean market is moving its price action dynamically, our Target hasn't changed, so the R:R hasn't changed. Maximum risk is what we paid for the option spread, which is 5 1/8.
And the maximum gain is the width of the option spread, minus the remaining extrinsic value when we hit the Target. The width is 1460 - 1450 = 10. If we get a huge bullish response from the Report, then we can say the spread should be worth close to the width. If we trim off half a point, maybe we're close to a maximum value. So, 10 - 1/2 = 9 1/2. As you can probably tell, I'm kind of fudging here. I could go through a more complicated and time consuming estimate, but I'd still have to guess the response to the Ag Report, so I think it would be a waste of time to do the more in-depth analysis.
So, say a best case for a bullish report and selling at our soybean price Target rather than holding
the position longer, our Risk is 5 1/8 points and the Reward is 9 1/2 points.
If we were to sell at the end of the day today, we'd have taken a loss of 1 point.
Bottom line, I decided its worth waiting to see what tomorrow's price action looks like.