Showing posts with label Natural Gas. Show all posts

Thursday, February 11, 2021

March Natural Gas Bearish Gartley - Post Exit Update 1


Above is today's 10 minute chart centered around the 10:30am ET "Natural Gas Storage" Report.

I entered a limit order to re-short at a 50% retracement back up. But, as you can see, price never got that high. At this point, with tomorrow being Friday, I decided it would be better to wait until next week to re-enter this trade, looking for a significant downside in accordance with the Gartley Pattern.


Wednesday, February 10, 2021

March Natural Gas Bearish Gartley - Exit


At 9:01am ET this morning I Tweeted "Moved Stop to break even on short position ahead of the Crude Oil Inventories at 10:30am ET in case there's a sympathetic reaction.".

At 9:32 I Tweeted the Stop was hit. We exited at 2.860. Profit was:

2.880-2.860=.020*$2500/pt=+$50.

Tomorrow at 10:30am ET we'll get the weekly Natural Gas Storage Report. Leaving a trade on during one of these reports is a craps shoot. That's just gambling without an edge in my opinion. There may be a way to have an edge, but I don't know what it is. I only want to take trades where I have a positive expectancy. So, I don't mind being out. However, we are still in the middle of a Gartley pattern. If we get a negative response to the report tomorrow, or otherwise resume a downward trajectory, I want to re-enter this short trade.

As long as the X point at 3.320 isn't breached, then I'll look for an entry point. I was thinking about having an automatic strategy, like a conditional sell order that's at least a minute after the report and the price is below today's Open or maybe below today's Low. But the reaction to the report might be crazy and last more than 1 minute, so I'll just trade it manually.

While I was considering entering the automatic order, I looked back at some previous Thursday's on the 1 minute chart to see how long the reaction to the report actually lasted. Here's what I found:


These are the 1 minute charts of 1/14/21, 1/21/21, 1/28/21, and 2/4/21. As you can see, the "stop sweeps" adverse reaction, if there is one, doesn't last more than 1 minute on this exceptionally small sample set. Didn't have time for a good study, but still wanted to do a limited search.

So, bottom line for today is we're safely out of harms way with a $50 profit, and looking to re-short NatGas after 10:30am ET tomorrow.


Tuesday, February 9, 2021

March Natural Gas Bearish Gartley - Update 1


Good day in favor of our short position. Today's candle combined with the past 2 days, form a 3 candle pattern called a Doji Sandwich. This is a Bearish pattern and suggests more downside.

Nothing to do but hold the short position. It hasn't been a big enough move to lower our Stop to break even yet.

Monday, February 8, 2021

March Natural Gas Bearish Gartley


We have a Gartley Pattern that satisfies my "relaxed" set of rules. By "relaxed" I mean it may not fit a traditional strict set of rules, such as the following diagram, but I was taught by a well known trader a more relaxed set of rules that still has a success rate of 65% or so. By "success rate" I mean it hits a 61.8% retracement of the AD leg.


Because its quite possible we'll continue higher and surpass the current D point, I want to mitigate our risk by using the QG mini contract, where 1 point is $2500, as opposed to the full size NG contract where 1 point is $10,000.

I went ahead and entered a bearish trade because the current D point satisfies the AB=CD Pattern where it reached the 61.8% Fib of the green range and the nearby 27.2% Fib extension of the yellow range. Like I just said above, price could continue to rise and make a new D point at the 78.6% Fib of the green range near the 61.8% extension of the yellow range. But if we wait for that and we drop from here instead, we'll miss the whole trade.

Entered today at 2.880.
Stop just over the D point at 3.060.
Target .618AD = 3.057 - .618(3.057-2.268) = 2.569 
    (actual target is 2.575 to account for slippage and .005 minimum increment in the QG contract.)

Risk: 3.060 - 2.880 = .180 * $2500 = $450.
Reward: 2.880 - 2.575 = .305 * 2500 = $762.50
R:R = 762.50/450 = 1:1.7 which isn't great but its acceptable.

(P.S. I know the trailing 0 on a decimal is unnecessary since its implied without writing it but it shows precision of the number and it looks nice. It also matches the way price is shown on the y-axis of the chart.)

Friday, December 18, 2020

March Nat Gas Bullish Retrace - Update 2


Well, what do you do here? On one hand there is no change in the technical setup that indicates a sell. In fact, we broke up through the Trend Line and closed above it. It still looks bullish to me.

But, on the other hand, we haven't made any decisive move to the upside. We're stuck in a sideways consolidation. We're still right on the Trend Line and its a Friday. 

Even though there appears be an upward bias, the biggest influence on whether to exit or hold in this particular situation is risk tolerance. Considering the size of this contract, and the potential for crazy headline risk, I decided the best thing to do is exit near the close today and decide whether to get back in next week.

So, we exited at 2.660 and took a small loss 2.660 - 2.705 = -0.045 * $2500/pt = $-112.50. I don't like taking any loss, small or otherwise, but I prefer a small loss to being long and a gap down on the open in 2 days. I thought about taking a hedge but that's only in case there's a gap up Sunday night. But if I took a 1:1 hedge then we wouldn't benefit from a gap up anyway. Exiting the hedge at the open would be the same as re-entering at the open. So, I decided to just take a small loss. 

Count this trade as a loss. We'll try and turn it around next week.

Thursday, December 17, 2020

March Nat Gas Bullish Retrace - Update 1


For March Natural Gas Futures, today might as well never happened. We kinda broke out to the upside, over and above the downward Trend Line and made a new swing high, but then we dropped precipitously. We kinda continued down below the 8ema, went below yesterday's low, but then we reversed and closed above the 8ema. So, as a result, there is no change in trend and nothing for us to do but wait for the next candle.

You might say "but wait a minute, we created a Bearish Engulfing candle where today's red body engulfed yesterday's green body". That's true, but since we closed over the 8ema, we don't want to act on that candle pattern yet.

Notice how today's volume 16,966 is greater than the past 4 trading days. I'd say that the Bears had a slight bias but not enough to decisively over power the Bulls. But it looks like a pretty good battle took place. If the Bears give up tomorrow, we could get a nice acceleration up.

Tomorrow afternoon will be a difficult call if we end with another neutral day, whether to exit for the weekend or take the risk of holding until Sunday night.

For tonight's after market trading, I'm just leaving our Stop in place and waiting for tomorrow.

Wednesday, December 16, 2020

March Nat Gas Bullish Retrace


Tempted to enter March Natural Gas futures long today, but we're not quite ready. We need to break through the downward Trend Line which is coincident with the 20sma, and close above it.

There's a risk from where we are to reject off the TL and 20sma and head back down. That's what happened the last two swing highs, and could certainly happen again. However, there is something special about 3 drives to a bottom (or top). It tends to retrace the full range of all 3 drives, which is the green range on this chart, to at least 50%.

Notice on the top chart, which covers much more time than the bottom chart, the current swing low came very close to the low on March 9th, 2020. This may represent support.

We've had 3 doji's in a row on the Daily chart bobbling between the 8ema and the 20sma. The downward Trend Line is now adding pressure to the squeeze. We're probably about to break out one way or the other very soon. But we haven't broken out yet, so its too early to enter a trade on the Daily today.

I have several indications that suggest the breakout will be to the upside. Here's what I see:

  • Bounced near previous low at 2.294, March 2020
  • Bounced after 3 Drives to a Bottom
  • Closed over 8ema
  • Unfilled Gap 2.957-2.920
  • Stochastics mid-range, providing ample runway
  • About to Break Through 20sma & Trend Line
Since we want to see a break through resistance, as described above, I entered a contingent order that won't trigger unless we hit 2.705. To prevent entering too high due to a gap up or a wide Bid/Ask spread at the market open, I added a limit price of 2.715.

Since this seems like a more risky trade, and an "expensive" contract, I'm using the QG mini-contract  ($2,500/pt) instead of the full sized NG contract ($10,000/pt).

Entry: Buy Stop 2.705 Limit 2.715
Target: 50% Fib=200sma=S/R=2.850
Stop: 2.580 just below recent swing low

Risk: 2.715 - 2.580 = .135 * $2500/pt = $337.50
Reward: 2.850 - 2.715 = .135 * $2500/pt = $337.50
R:R = 1:1 a statistical oddity. Not great but acceptable.


Thursday, December 10, 2020

Jan Nat Gas Rising - Post Exit Update 2


The top chart is a 15 minute chart just before the close. The bottom chart is the Daily just about the same time.

As you can see on the 15 minute chart, it was a good thing we weren't long when the 10:30am ET weekly Storage Report came out...not! Without inside information, like in "Trading Places", you should be very cautious about scheduled reports. Its always a crap shoot. But this one did favor the direction I suspected on a technical basis. That's why we entered this trade initially. Can't be too upset about missing a win when you don't really have an edge.

Then the question becomes whether to re-enter the long trade or not. The 15 minute looks a little tired and the Daily isn't closing over the 8ema. So, at this point it doesn't look like time to go long yet. Going to continue monitoring.

Today and tomorrow are the quarterly roll over days. This is a good time to transition over to the March contract while we're not in a trade.

Jan Nat Gas Rising - Post Exit Update 1


We started a leg back up in the middle of the night (NYC time). On one hand I feel sorry I missed getting in on the bounce when I suspected it was coming, but on the other hand, I don't want to be in the market at 10:30am ET when the Nat Gas Storage report comes out. Besides, Stochastics are overbought on the 15 minute when I woke up and saw the rise.

So, think I'll just monitor for now.

Wednesday, December 9, 2020

Jan Nat Gas Rising - Exit


At the peak this morning 12/9/20, on the 15 minute chart above, you can see the high candle and the candle after form a Bearish Harami pattern. Then 3 & 4 candles after form a Bearish engulfing with a close below the 8ema. Then the next candle confirmed it by beginning to continue downward. Plus we had completed an AB/CD pattern overnight (see the thick white angled lines).

That combined with the fact I had a 5 hour live workshop with Larry Pesavento today that already started 9:00am, suggested to me we should capture our profits and sit out the rest of the day in Natural Gas. The point being we had profits, peaked and started downward, and it would be difficult to manage this trade while at the workshop.

So, we exited at 9:37am ET at 2.49. As you can also see, we ended the day further down. Although we did come down to the 61.8% Fib of the yellow range, which is a likely place to bounce. Perhaps we'll get back in tonight or tomorrow.

Meanwhile, we had a winner:

Entry: 2.450
Exit: 2.490
Net: 2.49 - 2.45 = .04 * $2500 = +$100

Tuesday, December 8, 2020

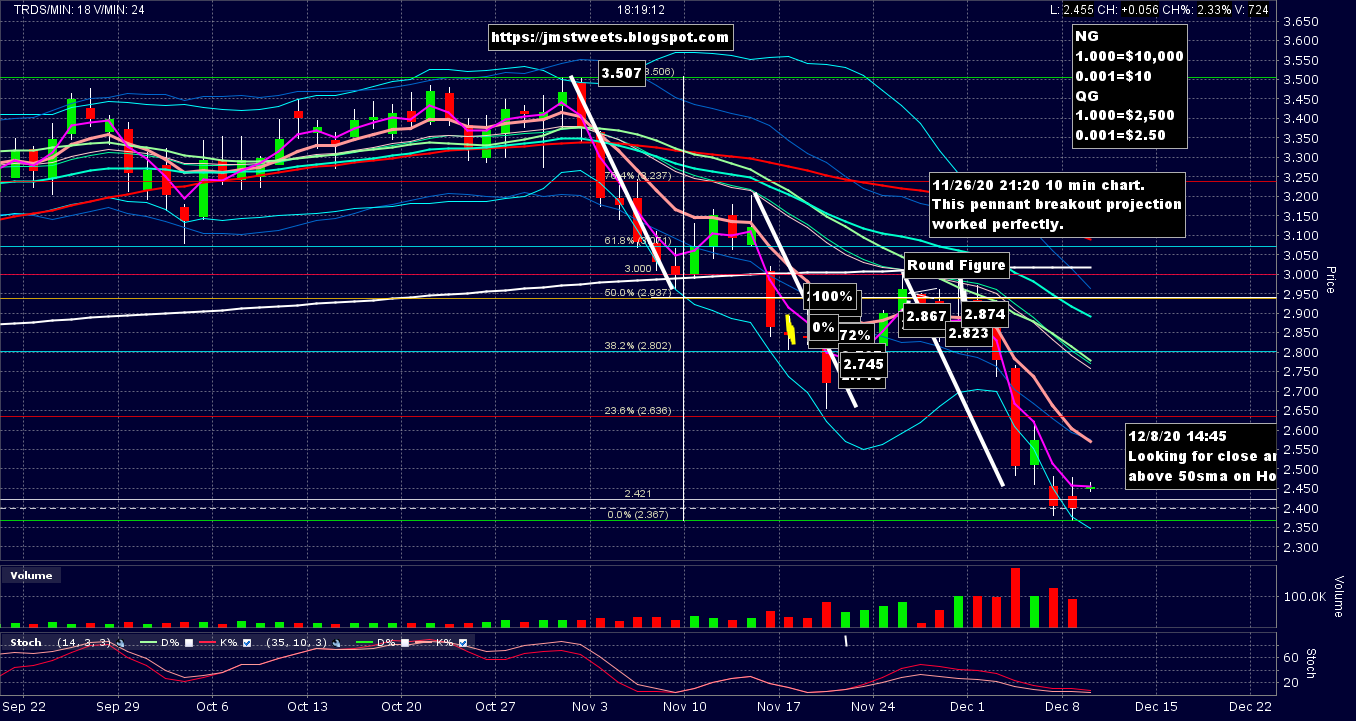
Jan Nat Gas Rising


Top 2 charts are Daily. Bottom chart is hourly.

I see:

  • 3 drives to a bottom
  • Hitting support from previous swing low
  • Very low Stochastics
It's not really a very strong setup, so this is higher risk than usual, and we're in way early relative to my rules. But the Risk:Reward is fantastic.

Entry: 2.450
Stop: 2.350
Target: 2.935 (50% Retracement)

Risk: 2.35 - 2.45 = .10 * $2500/pt = $250.00
Reward: 2.935-2.450 = .485 * $2500/pt = $1212.50
R:R = 1:4.85

Friday, September 11, 2020

Oct Natural Gas Deflating - Exit


How to risk $12,000 for 9 days, do everything right, and make $25.00! That should be the title of this trade. Well, I must of done something I thought was right, but maybe it wasn't. Of course, traders can do everything right and still lose money due to the randomness in the market. So I should be happy I ended positive, right? Let's take a look at it and see if there's something to learn for the future.

First, let's discuss the exit. Yesterday I said I'd micromanage the exit in the morning. I woke up to find a consolidation channel. I waited until a likely breakout showed up around 8:30am ET. Here it is on a 10 minute chart:


You can see 2.320 would be a good Stop. Its just over the top of the consolidation. So when we got the breakout I lowered the Stop to 2.320. Well, you can probably guess what happened next:


Stop was hit 9:05:45 am ET. We covered at 2.325. I really didn't mind that much. I was glad to be out with what felt like a nice profit. We could have easily been hit at 2.410 instead, or something worse earlier in the trade.

But look at the Daily chart above. It was captured after the close. The low of the day was 2.246, landing right on the 50sma. You might remember yesterday I raised the target to 2.250. If I didn't try to optimize the exit, the exit would have optimized itself. Would have been perfect! Would have made an additional 2.325 - 2.250 = .075 x 2500/pt = $187.50.

The final net on this trade without commissions:

2.475 - 2.325 = .150 * 2500/pt = $375 core position
2.485 - 2.580 = -.095 * 2500/pt = $-237.50 second position
2.425 - 2.410 = .015 * 2500/pt = $37.50 trying to add back 2nd position but hit stop
2.365 - 2.425 = -.060 * 2500/pt = $-150 trying to add back 2nd position but hit stop
375 - 237.50 + 37.50 - 150 = $25

I went back and read all my posts in this thread looking for something to improve. Don't see anything wrong with the entry. The fact we came so close to the target supports the validity of trade setup. 

One improvement I see is to check other time frames before entering the trade. I only noticed the Head & Shoulders pattern on the 4 hour chart after we had already entered the trade based on other indications. What if there was a counter-indication? Don't want to find that after entering the trade.

When price went against us in update #3, I think taking off half our position was the perfect move. In fact, price came right back down the next day, so good thing we still had our core position. We definitely would have lost ground trying to get back in. Don't see an improvement here.

Another improvement is where I put the Stop when adding back in the supplementary position. I was using the 10 minute chart to enter, so I used the 10 minute chart to set the Stop. That seemed prudent and cautious but now I think it was a mistake. I should have used the Daily chart to set a Stop like I did when we first added a supplementary position after seeing the Head & Shoulders. It means much more of a loss if its hit, but if I had done that we would have made an extra 2.425 - 2.325 = .1 * 2500/pt = $250 instead of losing $112.50.

Is micromanaging the exit on a 10 minute chart when we're close to our target a mistake? Sometimes price pulls back just shy of a target, and doesn't come back. I usually shade my targets by a couple/few points to handle a near miss as well as bid/ask spreads. I suppose there are some trades that are better left alone, but this wasn't one of them. There were many possible reversal points and an observant trader could manage that situation to a better outcome than just letting things play out on their own.

Not seeing anything else at the moment. If you see something in the managing of this trade that could be improved upon, please let me know. Meanwhile, guess this counts as a win.

Thursday, September 10, 2020

Oct Natural Gas Deflating - Update 6


This morning at 10:30am ET the EIA Nat Gas Storage Report was scheduled to come out. I tightened our Stop Loss to 2.450 in case we got a big bullish surprise. At 9:17 I lowered it further down to 2.410, which is just over today's high. 

At 13:00 ET I raised our target to 2.250. This is more centered in the group of possible support levels that could be the reversal point. Stochastics are oversold now and we don't want to miss our exit right before a fast bounce back up. The 2.225 was a good initial target and it may will get hit, or price could continue significantly further down. But now that we're near, we can see where the support levels are:

  • The AB/CD projection (thick yellow angled line segments) suggest about 2.277.
  • The Head and Shoulders projection (purple thick vertical line segment) suggests about 2.250.
  • The 50 SMA (curvy thick red line) suggests about 2.245.
  • The previous swing low on 8/12/20 is 2.228.
  • The 50% Fib retracement of the green range is 2.222.
  • The 61.8% Fib extension of the yellow range is 2.212.
  • The 200sma (very long wavy horizontal thick white line) is 2.182.
We are trying to get as much profit as possible. If we set our target too low then we have to chase the reversal. If we set it too high we miss out on additional price movement in our favor. Picking the exact bottom before it is established is nearly impossible, although I have done it many times, but I wouldn't argue if you said those occasions probably had some element of luck. Where the luck isn't in my determination of the target, but rather that the market respected the support level I picked and with high precision.

My plan is to use the 2.250 target, then if its approached after I can get to my computer in the morning, I'll go down to the 10 minute or maybe even the 3 minute and micromanage the exit the best I can.

2.250 isn't the highest target but it is near the top of the target set. My temptation is to use the highest target to minimize the chance of missing the reversal. Of course, price could reverse before hitting any of these targets. 

The nightmare is that prices drift up overnight and hit our 2.410 Stop. Its up to the Trading Gods now.

Wednesday, September 9, 2020

Oct Natural Gas Deflating - Update 5


The top chart is the Daily and the bottom chart is the 10 minute for the whole day. You can see we got a bit of a retracement. Just about touched the 8ema then retreated. 

Yesterday I said "I think there is a reasonable chance for a partial retrace overnight and maybe into tomorrow." Well that's exactly what happened. So I wanted to add another short position. I did, but I used a stop based on the 10 minute chart rather than the Daily chart to control risk because that big pop we got this last Friday was a sign we need to feel some doubt on this trade. You can see the 10 minute was a bit choppy. I actually added a position twice today, but both times it hit the Stop Loss. Ended up losing $112.50.

So we still have just the original core position. The good news is we closed near yesterday's close, and under the 8ema and even the 3ema. We're still on track for our target. Although, Stochastics are getting a little oversold and we're hitting possible support at the 34ema and a previous swing high around Aug 5th - 10th.

We could get a significant bounce to retest the bottom of the channel trend line. That would put us above our 2.475 entry and in negative territory. I think that would be a bad idea in this trade. So, I lowered our Stop to 2.450. We'll see what the morning brings.

Tuesday, September 8, 2020

Oct Natural Gas Deflating - Update 4


When people say "I hate to tell you I told you so" what they mean is they are loving the fact that they can. In my previous post I was wrestling with what to do about the significant reversal, and I mentioned "I've seen many trades that do a quick 50% reversal, then resume the original direction." Hello :) Check the chart of today's action shown above. That's exactly what happened. So, at the moment I'm happy with how I handled last Friday's adverse move. But of course I wish I hadn't exited the second position. That's just a wish. I think I did the right thing by taking off half our position and cutting our risk while preserving a core position to benefit from the resumption of the trend.

The Nat Gas market wasn't completely closed yesterday. It was open until 13:00 ET. Not sure if that makes a valid candle or not, but when combined with Friday's candle they make a Bearish Harami candle pattern. Then today we continued the drop and closed below the 8ema, 20sma, Head & Shoulders Neckline, previous swing low, and the 34ema. This is a relatively large candle and with good volume, so we seem to be back on track to our target.

There's the question of whether to add to our short position. Being that this is a large sudden move, I think there is a reasonable chance for a partial retrace overnight and maybe into tomorrow. I'd like to wait and see if that happens. If it does we can add a position at a higher, more advantageous level. If it doesn't, we'll see if there's enough room left to our target where it makes sense.

Friday, September 4, 2020

Oct Natural Gas Deflating - Update 3


When it comes to the markets, "Anything can happen, and it usually does".

And here's another quote, from my original post on this trade on Sep. 2nd:
"This Friday will probably bring a difficult choice because this weekend coming up is a 3 day weekend in the USA"

Anticipating this didn't help much when it came to fruition. Look what happened today. We started down, breaking through the Trend Line. Great, this was in our favor and very welcome. But we bottomed out around 10:00am ET and trended up the rest of the day. We broke through the Head and Shoulders Neckline and the 8ema, and closed near the top. The bobble I discussed yesterday has resolved to the upside. Not what I was expecting nor wanted.

Notice today's bullish candle body engulfs the previous day's Doji body. That makes these 2 candles a Bullish Left/Right Combo candlestick pattern. Of course this is a bullish indicator. Also, we are resuming the up trend outlined by the channel we've been in. And Stochastics are mid-range, so we're not seeing pressure from being overbought. 

Apparently the appropriate action is to exit this trade, especially facing a 3 day weekend, right? Well maybe, but let me give the bearish side of this trade. First, we have a ton of bearish indications as of yesterday. Maybe we shouldn't just abandon all that so quickly.  The other thing is that I've seen many trades that do a quick 50% reversal, then resume the original direction. You can see we made a high today within the yellow range between 50% and 61.8%. I drew the yellow range to cover the previous down leg on the Daily chart. If this is one of those trades that does an annoying partial reversal before resuming the original direction, then it would look just like this chart. What matters now is how the next trading day goes. If it continues up, then we're scr.., uh... out of luck. If we see that, we'll have to exit the trade. The Bullish Left/Right Combo is a real thing to be respected.

So, since everything hinges on how price goes next, and I think we're looking at a 50/50 proposition, do we really want to just completely exit the trade? Its possible we gap down and continue down on the next trading day. So saying we should exit now because we can always get back in, isn't quite true. A significant gap is more likely after a 3 day weekend than a 2 day weekend. We could get back in but we could lose a lot of ground (meaning profits).

Conveniently, but maybe not fortunately, we have a double sized position on this trade. So what I did is to wait until the last minute today to see if we'd close under the 8ema, then when we didn't, I covered half the position (the second position). The original position is still on. So we reduced the risk and retained our opportunity to profit from this trade. 

If NG continues up the next trading day and hits the 2.685 Stop vs getting out today at 2.580 we'd lose about another $250. If NG has a bearish day then we can add that position back on, maybe at a less advantageous level but still a potentially profitable one.

So, bottom line is we lost some money today to prevent a bigger loss.

Sold at 2.580 at 16:57:57 ET:

2.580 - 2.485 = -0.095 * $2500/pt = -$237.50


Thursday, September 3, 2020

Oct Natural Gas Deflating - Update 2


We definitely took some heat from about 5:00am ET until the day session open. You can see it represented in the chart as the upper wick on today's candle. Having doubled my position last night, the unrealized loss started to look rather threatening. I'm thinking I can't believe such a great looking short setup is going to reverse and hit my Stop. But I just held on and sweated it out. 

I was so thankful the way we closed the day session. We closed today's candle as a Doji, which represents indecision. Looking at yesterday's and today's candles, both Doji's, it seems we're bobbling between the 8ema and the Trend Line forming the bottom of the upward channel that started around July 21st.

But, both days we closed under the 8ema, under the Head and Shoulders Neckline (on the 4 hour chart in the previous post), and under the 20sma. Look at how the Stochastics are accelerating downward. Everything we've said indicating a downward trend is still in place. Nothing has been invalidated.

So we continue to tolerate the consolidation here, expecting a breakout down through the Trend Line and a close below it. At that point we either wiz on down to the target, or we temporarily reverse to test the underside of the Trend Line, then continue back down. Well, anything can happen, but those two courses of action seem the most likely.

Wednesday, September 2, 2020

Oct Natural Gas Deflating - Update 1


I was checking on this trade at 10:00pm ET after we entered this trade earlier today, and decided to take a look at the 4 hour chart. Check out the bonus we got! The purple lines show a beautiful, symmetrical Head and Shoulders pattern.

The vertical purple line on the right is a projection of where price is likely to go. Notice its very close to the 50% Fib target. This reinforces all the other bearish indications listed on the previous post.

So given this new bearish pattern on the 4 hour chart, I added a trade. Short from 2.485, Target 2.250 (the H&S price projection), Stop 2.685 (just above the .shoulder at 2.675).

Risk: 2.685-2.485=.200*$2500/pt=$500
Reward: 2.485-2.250=0.235*$2500/pt=$587.50
R:R=1:1.18 (not great but a Head & Shoulders is a high probability pattern, and we have a slew of other bearish indications)

The total Risk for this trade is now 562.50+500=$1062.50
The total Reward is now $625+587.50=$1212.50

Oct Natural Gas Deflating


Shorted Oct Natural Gas today at 2.475, using the QG mini-contract, which is 25% less than the full NG contract. 

Here's why I'm bearish:

  • Rejected off the upper Trend Line.
  • Reject off the upper Bollinger Band.
  • High Stochastics.
  • Bearish Harami candle pattern.
  • Doji sandwich candle pattern.
  • Close below the 8ema.
  • Continuation/Confirmation to the downside today.
  • Heavy volume.
However, there is a risk of support from the bottom Trend Line, which is coincident with a previous Support/Resistance area. Additional possible support from the 20sma and 34ema, as well as at the 38.2% Fib which is in the middle of a previous Support/Resistance area. But after 5 price cycles (pullback followed by an advance higher), with pegged high stochastics, a 50% retracement of the full 5 cycles seems likely.

Target is the 50% Fib of the green range = 2.222, just above the 200sma, 50sma, and lower Bollinger Band.

The chart was captured 14:27 ET, and the NG market day session doesn't close until 17:00, so this may be considered a little early. However, we did get a close below the 8ema followed by confirmation today, which satisfies my entry criteria. It looks like a high probability trade.

This Friday will probably bring a difficult choice because this weekend coming up is a 3 day weekend in the USA. I don't like holding over a 2 day weekend, or even a mid-week 1 day market holiday for that matter :)

Entry: 2.475
Target: 2.225 (2 ticks above the technical target)
Stop: 2.700 (just above the previous candle's high)

Risk: 2.700-2.475=0.225*$2500/pt=$562.50
Reward: 2.475-2.225=.250*$2500/pt=$625.00
R:R=625/562.50=1.1:1 (not great but it looks like a high probability trade)