Showing posts with label Gartley. Show all posts

Thursday, January 12, 2023

XLE Re-entry - Update 1

XLE Daily


Looking good today! After bobbling between the downward Trend Line and the 50 SMA for a few days, we gapped up at the Open above the 50 SMA and stayed above it all day. We had decent volume, decent size green candle, and looks like we got a Bollinger Band/Keltner Channel squeeze breakout to the upside. We closed above all Moving Averages and closer to the top of the candle than the bottom. All this is bullish.

Unfortunately, we also entered a previous congestion area to the left, and Stochastics are now in the overbought area. We closed a little stretched above the 3 ema and 8 ema. These provide bearish pressures. It would be reasonable to have a pull back and retest the downward Trend Line.

Strangely, while our energy ETF is looking bullish, the Feb. crude oil futures has a bearish setup. I tweeted 15:47 ET today "Oil Futures Mar 4hr showing tweezer top near 78.6% Fib and a Gartley D point.". Initially, this seems like a contradiction, but we're dealing with apples and oranges. The XLE is an ETF constructed by equities, and the CL futures is the actual crude oil commodity itself. So, its perfectly reasonable that these two will sometimes diverge.

CL Mar Oil Futures 4hr Chart


I decided to hold the XLE long position since it appears the bullish indications beat the bearish ones, and we have now resumed the general upward trend.

(We also shorted the March oil futures, but that's a different trade.)

Thursday, June 23, 2022

JNJ No Tears Gartley Pattern - Exit

JNJ Daily at 9:46am ET


We opened gap up, then started to fill in the gap, but reversed back upward before even filling half the gap. This is quite Bullish, but there's a scheduled testimony by Federal Reserve Chairman Powell at 10:00am ET. That, plus the fact we're struggling a bit at the 50sma, led me to sell our position at 178.22, which is very close to the 179 Target.

At 9:47am ET I Tweeted:

"Sold the GARTLEY pattern near the 179 Target on JNJ. Want to be out before 10am ET Powell testimony."

The .618AD Target at 179.27 was subsequently hit 14:23 ET.

This has been a beautiful textbook trade. Everything worked as it should with very little heat or gray areas.

Summary:

Bought JNJ Aug 175 Call for 3.52 6/14/22
Sold for 7.95 6/23/22
795 - 352 = $443 profit.
795/352 = 226% increase.
443/352 = 126% return.

Wednesday, June 22, 2022

JNJ No Tears Gartley Pattern - Update 1

JNJ Daily


Great day for our JNJ trade. Got a big candle on big volume with a Close above the 20sma. We bounced off the 50sma, which is a concern, but we've breached it many times before.

We made a higher high and a higher low. The ADX made a bullish cross. Stochastics are still in the mid-range, so no selling pressure from that.

We hit the .5AD level, which is constructive, and we closed in the upper half of today's candle.

The Aug 175 Call option, for which we paid 3.52, had a high today of 7.60. That's better than a double. The voice in my head was quite disappointed when I didn't succumb and sell the option to capture the profits. Especially since I've had trades where I exercised discipline and held out for the target, but the chart reversed the next day and I ended up with much less profit, or worse.

But it looks like we only need one more green candle and we'll hit our 179 target. Plus everything looks bullish for this trade. 

So, bottom line, I held the line and held our position for another 3 points. Looking at the option chain, it looks like between today's stock close 175.74 and our Target 179, we'll get an average Delta of about 60. So, if we hit the Target, the additional profit would be approximately 3.25 * 60% * 100 = $195. 

Seems like holding the position is the smarter trade, albeit the more uncomfortable one.


Tuesday, June 21, 2022

JNJ No Tears Gartley Pattern

JNJ 6/21/22 Daily Chart


Went long with a JNJ Aug 175 Call on 6/14/2022 for $3.52. At the time, the stock was 168. I entered due to the confluence of the AB/CD, 200sma, and 61.8% Fibonacci retracement. But I got in early, without confirmation. We got that confirmation today, with a close above the 8ema.

Here's what I saw today:

  • Bounced off 61.8% Fibonacci of the Gartley pattern
  • Bounced off 200sma
  • Bounced off AB=CD of the Gartley pattern
  • Oversold Stochastics
  • ADX Quit the Down Trend
  • Trend Kicker candlestick signal
  • Close over 8ema
Set the Stop to 167, just below the D point.
Set the Target to 179, just below the .618AD level of the Gartley pattern.

Maximum Risk is the full cost of the Call option, $352. But a better gauge for comparison to other trades is to use the stock value:

Risk = 168 - 167 = $1.
Reward = 179 - 168 = $11.
R:R = 11/1 = 11:1 which is ridiculously great. To be fair, the initial risk wasn't the current Stop. The initial Risk was 168 - 155 = 13, which would represent a bad R:R. 

Let's look at the R:R if I got the 175 Call option at the end of today, but based on stock price. Today's close for JNJ was 173.01:

Risk = 173 - 167 = 6
Reward = 179 - 173 = 6
R:R = 1:1 on this basis, which is considered too low. However, this trade is based on the Gartley pattern, which has a Win Rate of 75%. So, given the Win Rate, 1:1 is acceptable.


Wednesday, June 8, 2022

ZIM Zooming Down

ZIM Daily


Shorted stock ZIM this afternoon by buying a July 55 Put for $3.20. Quarterly Earnings is 8/17/22 before the market opens. I Tweeted this out at 15:39 ET.

Here's why I'm bearish:

  • Kicker candlestick pattern
  • Blue ice failure
  • Negative Stochastics Divergence
  • Close below 8ema,200sma
  • High volume, Big bar
  • AB/CD
A Kicker pattern is when you have 2 candles separated by a gap and facing different directions (Up and Down).

Blue Ice Failure I learned from Steven Bigalow in candlestickforum.com. Its when price comes up from below the 50sma, breaks through it but can't hold it, and falls back through the 50sma. Steve uses blue for his 50sma while I use red. That's why he calls it Blue Ice Failure.

To see the NSD, look at the downward angled thick, white, line segment in the Stochastics panel at the bottom of the chart. Then see the upward thick, white, line segment on the price chart directly above. Price was heading up while Stochastics was heading down in the same time period. That's Negative Stochastics Divergence and a bearish indication.

The AB/CD pattern has not been confirmed yet because it hasn't closed below the B point at 48.21. So I did get in early but I figured it was a reasonable decision thanks to all the other bearish indications. The measured move for where to expect price to go is the D point where AB=CD, which can be calculated by D=C-(A-B)=71.40-(91.23-48.21)=28.38.

The calculated D point coincides with the 78.6% retracement at A-.786XA=91.23-.786(91.23-11.34)=28.44. So this area makes a good target.

Also, if we get to the target, then we will have set up a Gartley pattern. So the Target is a great place to reverse our position.

Summary:

Entered 6/8/2022 15:13 ET, ZIM=58.91, Bought July 55 Put for $3.20
Target 29 (which is shaded a little to account for slippage, bid/ask spread, and an early completion)
Stop is just above the Kicker at ZIM=70

Using the stock to calculate the risk:reward ratio:

Risk = 58.91 - 70 = -11.09
Reward = 58.91 - 29 = 29.91
R:R = 29.91/11.09 = 2.70 which is great.

Monday, March 14, 2022

June AUD/USD Russian Doll Gartley Patterns - Exit


At 15:38 ET I Tweeted:

"The 2nd Target we were waiting for was .7201 on the Gartley AUDUSD trade. When I checked it I saw it reversed at .7202! So I sold it at the market at .7217. Details later."

Because I had a Stop and a Limit order working, I didn't need to check on this trade very often. When I did check, I was shocked but not surprised price had dropped to within 1 pip of our Target and then reversed up. That's so close that I needed to assume that was the swing bottom, and I better get out immediately. Unfortunately, the Ask was .7217, but it didn't matter. If we did establish the swing bottom, then the odds are price will continue upward. It doesn't make sense to hang on, hoping it might dip down.

But, of course, the trading gods love to add insult to injury, so soon as I covered the trade, price headed back down to a low of the day at .71955:


Had I not checked on the chart at all, it would have hit our 2nd Target and then some.

With regard to the yellow range Gartley pattern, the first 3 targets were hit. The 4th target is very seldom ever hit.

So, bottom line:

Target 2:

Enter .7372
Exit: .7217

.7372 - .7217 = 155 pips * $1.00/pip = $155. If we used the full sized contract, it would have been $1,550.

Target 1 profit: $68
Target 2 profit: $155
Total: $223


Friday, March 11, 2022

June AUD/USD Russian Doll Gartley Patterns - Update 1

1 Hr Chart

15 Minute Chart


You can see on the 1 hour and 15 minute charts above, in the purple, that a 3rd Gartley pattern developed over night last night. I tried trading it but after the D point, price only got up to .73425, which is less than even the .5AD level. Then it meandered downward and broke the X point.

I admit it was weird trading a Bullish pattern when the other bigger patterns were Bearish. But you can see a nice up leg when the C point formed. So it was very reasonable to anticipate we could hit the .618AD of the purple range. 

And, I have learned that when you have a methodology with a proven edge, then you must take every set up, because you never know which individual trade will fail. The Gartley has a proven win rate of about 75%. So, even though this 3rd pattern was in the opposite direction of the core trade, I had to take it.

Now for the good news. The Target for the yellow range was .7304, as described in the previous post. We hit that at exactly 15:00 ET. So the first of the 2 planned trades has completed, and we have the other one still working.

Since the 3rd pattern that developed overnight, and failed, was not a planned aspect of this trade, I'm going to leave out the P&L from that separate trade.

The profit from the 1st half of the trade is:

.7372 - .7304 = 68 pips * $1.00/pip = $68. If we used the full sized contract, it would have been $680.


Thursday, March 10, 2022

June AUD/USD Russian Doll Gartley Patterns


This is going to be a crazy trade. I was setting up the Gartley pattern on the AUD/USD 60 minute chart above and when I was finished, I noticed there's another smaller Gartley pattern inside the first.

The bigger Gartley, let's call it the 1 hour (1h) Gartley, is still establishing its C point. I was going to wait for the D point before entering a trade. But the smaller Gartley, let's call it the 15 minute (15m) Gartley, is establishing its D point. 

The 1h Gartley has white comments and green Fibonacci's. The 15m Gartley has yellow comments and yellow Fibonacci's.

So, we can enter the 15m Gartley, but instead of using the usual .618AD Target, we can go for a bigger Target of the 1h Gartley D point. However, I want to be conservative and trade each pattern separately.

I got 2 AUD June futures using mini-contracts because the risk is 85 pips. If I used 2 full contracts I'd be risking $1,700.

I bought the 2 futures at .7372. The Stop for both is just over the X,A point at .7457. The first Target is the .618AD of the 15m Gartley. Using the current D value of .73775, the Target is:

.73775-.618(.73775-.72555)=0.7302104

The second Target is the 78.6% Fibonacci of the 1h Gartley XA leg, which is .71797. Also, using the current C point, the calculated D point is:

.73775-(.7455-.72555)=.7178, which is amazingly close to the .71797 Fib.

We'll shade the second Target a bit because on the way there, we'll encounter the .7200 level, which is a round number. You might point out we'll also be encountering the .7300 level, but that's nowhere close to the Target. Also, there is some possible support from a gap down and swing low from late February. This adds to desire to shade the second Target up to the .7200 level.

Now, here's more craziness. There's a speaking engagement in Australia by RBA Govenor Lowe at 17:15 ET, while the FX market is closed between 17:00 - 18:00. So, come 18:00 this evening, we may get a gap open but there's no telling in which direction. I could have waited until after 18:00 to enter, but I decided I can handle the risk.

Bottom Line:

Trade 1

Enter: .7372
Stop: .7457
Target: .7304
Risk: .7372 -. 7457 = -85 pips.
Reward: .7372 - .7304 = 68 pips.
R:R : 68/85 = 1:0.8 This looks bad but remember the Gartley pattern has a 75% Win Rate, which means you could have a R:R of 1:0.3 and still break even. Plus we have the 1h Gartley that may pull down price further than usual.

Trade 2

Enter: .7372
Stop: .7457
Target: .7201
Risk: .7372 - .7304 = 68 pips.
Reward: .7372 - .7201 = 171 pips.
R:R = 171/68 = 1:2.5 which is great.

Friday, February 11, 2022

Golden Gartley - Exit

GC Apr 4hr


Well, that went well...not! News came out that Putin decided to invade the Ukraine and Gold went nuts. Straight up like a bottle rocket. Fortunately, I had a Stop working at 1845. At 16:45 ET, the high today was 1867.40. If I ratcheted my Stop up, or worse, deleted it, my situation would have been much worse.

My gut reaction is always "What did I do wrong?" and whether I did something wrong or not the next question is "What can I learn from this?", then finally "How can I improve my trading going forward?". 

The answer to the first question is I didn't do anything wrong. I entered a valid pattern that has about a 75% Win Rate, which means it fails 25% of the time. This is one of those trades in the 25%. Its that simple. I followed my rules, so I didn't do anything wrong.

What I can learn is always use a Stop. And unless there's some unusual circumstance, don't move it because you think it might get hit. Duh! 

Also, its a good opportunity to learn how to accept a loss. It feels bad, but you know before you go into the trade there's a significant chance it will fail. So why feel bad when it happens? Because its human. But it helps to remember there will be many trades in the future where this pattern will win. Its been in the public about 36 years thanks to Mr.  H.M. Gartley. So we know it's reliable. No need to start blaming this and that. It doesn't matter. This pattern will occasionally fail no matter what.

Once you have a methodology with an edge, all that matters is your faithful execution.

Bottom line:

1814.90 Entry - 1845.10 Stop  = -30.2 pts * $10/pt = -$302.00 loss.

Thursday, February 10, 2022

Golden Gartley

GC Apr 2022 4hr


Annotations for this trade are in yellow on the 4 hour April 2022 Gold Futures chart above. You can see the X,A.B, and C points of the Gartley (aka XABCD) PATTERN. The first D point I chose was surpassed by higher price action. So I changed the label from 'D' to 'D1", then added the D2 point when I thought it appeared. But this was also surpassed by the D3 point, which was today.

As you might guess, I've been in this trade for a while, but I haven't posted about it. I don't include most of my trades in the blog because either they are on a short time-frame, or high risk, or I just don't have the time. I'm including this trade now because I think D3 is the final D point for this Gartley pattern.

We had an impactful CPI report this morning, 2/10/2022 at 8:30am ET, which led to a rather dynamic day in the price action. Looking back on this 4 hour chart, you can see we formed a Bearish Engulfing candlestick pattern, with a close below the 8ema, followed by a continuation candle. This is significantly more bearish than the other D points. Plus Stochastics really took a dive.

What you can't see is how close today's high came to the Stop. Here's how I entered this trade on 2/7/22:

Entry: 1814.90
Stop: 1845.00
D3 Target: 1804.60 (the D1 and D2 targets were lower and no longer of interest)

Today's high was D3 at 1843.30, just 1.70 points from the Stop. That was just luck, and I'm very grateful to be so lucky.

The current targets are shown on the chart in yellow. The actual target for this trade is 1806.00 which shades the exact target to accommodate the Bid/Ask spread, and other slippage.

OK, now we're all caught up. Let's see what happens next in this crazy market.


Wednesday, January 19, 2022

March Soybeans Formed a Bearish Gartley - Update 1


Wow, that happened fast. Yesterday we had a nice Bearish Gartley pattern, today we had a strong reversal. Today's candle combined with yesterday's candle forms a "Doji Gap Up" candlestick pattern. This is a strong indication of a change in investor sentiment.

When price crossed the 8ema and continued strongly, I decided to avoid greater losses and get out. At 9:36am ET I Tweeted "Dumped the March Soybeans Futures. Details later.". I watched the chart periodically during the day, looking for a reversal but it never came. 

I think exiting was the right strategy, but there's still hope. We're still in a Gartley pattern that hasn't failed. It hasn't even invalidated the D3 point. Neither have we violated the downward Trend Line you'd get if you connected the candle tops for the past 7 days.

I see four likely scenarios from here:

  1. We quickly start heading back down.
  2. We briefly continue upward but reverse back downward before violating the D3 point.
  3. We form a new D point and head back down before violating the X point.
  4. We violate the X point and set up a Butterfly pattern.
Because I have no idea which of these will play out, or some other scenario, I don't want to reverse our position to a long trade. Since we don't have an edge, it's better to just monitor the chart until we see a high probability opportunity.


Tuesday, January 18, 2022

March Soybeans Formed a Bearish Gartley


Been trying to catch the D point on the Daily chart above. The first two, D1 and D2, failed but D3 led to price action breaking through the 8ema and closing below it with confirmation, which gives confidence this is the one. Its looking so weak, I decided to get in short, even though we're pretty far from the 1415 D3 point already. Even down this far, we still have a good Risk/Reward. More on the R:R later.

The proper Stop for a Gartley pattern (aka XABCD) is just above the X point, but that represents too much potential loss (Risk) if we hit it. So, we're using the recent swing high (D3) instead of the X point.

The Target is the usual .618AD, which is the 61.8% Fibonacci retracement of the A point to D point range. You can find all the Targets to consider in the box on the chart.

So, right at the Close today, I shorted a YK mini-contract at 1361 1/4.

Summary:

Entry: 1361 1/4
Stop: 1416
Target 1279 (shaded a little from D3 point to allow for slippage and the Bid/Ask spread)

Risk: 1416 - 1361.25 = 54.75 points * $10/pt = $547.50
Reward: 1361.25 - 1279 = 82.25 points * $10/pt = $822.50
R:R = 822.5/547.5 = 1.5:1 which is actually quite good if you consider the Gartley pattern has a 75% success rate at the .618AD Target.


Friday, January 7, 2022

Citi Group Gartley Pattern - Update 4


Above is a wide view and zoomed in view of the Daily chart. We had a continuation day in our favor, which is good, but I'm becoming concerned about the overbought Stochastics. I mentioned it last time as well.

Our Target of 71.62 is on the other side of the 200sma. The 200sma could easily provide enough  resistance on its own to send us back down for a retrace before reversing back up. But combined with the Stochastics being overbought, its even more likely. 

This would be problematic because the Earnings Report is on 1/14/2022 before the market opens, which means we need to exit by the Close on 1/13/2022. A reversal could have us down significantly right when we have to exit.

So, considering this situation, I think I'll exit this position if we hit the 200sma instead of waiting for the .618AD Gartley Target. The 200sma at today's close is exactly 70.00. 


Monday, January 3, 2022

Citi Group Gartley Pattern


Both charts above are Daily charts. The top chart is widened out to see the Gartley pattern. My own research has proven to me the Gartley pattern has a fantastic success rate of approximately 75%. I define success as hitting the .618AD level before breaking the X point level.

The bottom chart is zoomed in to see the Doji Gap Up candlestick pattern made by today's candle and the previous candle. This formed on high volume. This is a very Bullish indication.

On the zoomed in chart, it also looks like we're forming a Fry Pan Bottom candlestick pattern. If we break out of that to the upside, that would be a very Bullish indication.

So, based on the above, I got a Jan 60 Call for $3.40. I know that Theta time decay is relatively high given that there's only 3 weeks left until expiration. To deal with that, I plan to turn this position into a Call Spread after a sufficient increase in the stock price. If I can sell a 72 strike Call option for $3.40 then I'll have a risk free trade.

The good thing about being close to expiration is that Gamma is also high. So if the stock price rises, the option value will rise quickly.

The Quarterly Earnings Report is due out Jan 14th at 8am ET. I plan to close this position before then. If the target isn't hit by the ER, then I'll sell the option on the afternoon of the 13th, which should enjoy a boost in Implied Volatility.

Since we have defined risk, thanks to using options, I'm not very concerned about a Stop. If I had the stock, I'd put the Stop just under the D point of the Gartley, or if I could afford the potential loss, a better spot would be just under the X point of the Gartley.

For the Target, I'm using the .618AD Fibonacci retracement level, which is 71.62.

Wednesday, December 29, 2021

March Wheat did an about-face


Above is today's Daily chart of March Wheat futures right after the grains market closed. Just before the Close I shorted a YW mini-Futures contract at 790. The mini-contract is $10/pt, while the full size contract is $50/pt.

In the previous Wheat trade on this blog I wanted to go long due to a Gartley pattern. That Bullish pattern has not yet been violated, so this is a bit of a contradictory situation. However, my Target for this Bearish trade is above the X point of the Gartley pattern, so both trades can work.

Here is what I saw that caused me to go short today right before the market Close:

  • Head & Shoulders
  • Bearish engulfing candlestick pattern
  • Continuation by the next candle
  • Close below the 8ema, 20sma, and 50sma
  • Close below the H&S Neckline
  • Possible Bollinger Band/Keltner Channel Squeeze
  • Possible AB/CD (light blue angled lines)
However, I also see we had support from a previous Support/Resistance level, and we formed a Bullish Harami candlestick pattern. Today we formed a Doji candle which represents indecision.

We could turn right around and head back up from here to hit the Gartley .618AD Target, and we haven't yet confirmed an AB/CD by dropping lower than the B point at about 750.

So, I don't have a lot of confidence in this Bearish trade yet, but there are enough indications where it makes sense to enter the trade, albeit lightly.

I set the Stop at 801. I picked 801 rather than 800 because 800 is a round number. It's just above the H&S Neckline, 8ema, 20sma, and 50sma. It's a bit of a tight Stop, but this is not yet a high probability setup. And if we break through all that resistance, then the downward momentum that got us where we are can't be very strong. So stopping out early might be a good thing.

I set the Target near the 727.643 78.6% Fibonacci level of the yellow range, which coincides with the 200sma, the measured move of the white AB/CD, and shades the light blue AB/CD and the full measured move of the Head & Shoulders.

Summary:

Entered: 790
Stop: 801
Target: 729

Risk: 801 - 790 = 11 points
Reward: 790 - 729 = 61 points
R:R = 61/11 = 1:5.5 which is ridiculously good.


Thursday, December 23, 2021

Wheat Marching to a Reversal - Exit


Above is Yesterday's  March Wheat futures Daily chart. Yesterday, 12/22/21 at 8:47am ET, I Tweeted:

"Well, the Mar Wheat Futures setup is finally ready to trade, but the Risk:Reward is bad. So, have to pass :("

Sometimes being diligent will cost you entry to a trade. There's an old saying I like "I'd rather be out wishing I was in, than in and wishing I was out".

If I waited for confirmation and then entered, it probably would have been around 805. If I did, I would have set the Stop to 750, just below the D point at 751. The Target would be 827, which is the 61.8% Fibonacci based on a Gartley pattern with the D point at 751. You can see the targets listed on the chart.

The Risk:Reward would have been:

Risk: Entry - Stop = 805 - 750 = 55
Reward: Target - Entry = 827 - 805 = 22
R:R = 2.5:1 which is the opposite of what you want, and way to bad to trade. In addition, A risk of 55 on a mini-contract of $10/pt would be $550, which is a little too high.

So, unfortunately, I'm sitting this trade out and keeping my capital dry for the next trade.


Thursday, December 16, 2021

Wheat Marching to a Reversal


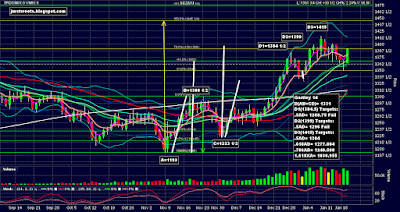
The Wheat March Daily chart above looks very busy but its a really cool setup and I'll explain the whole thing. I'll explain the different elements of the setup then pull everything together at the end.

Let's start on the left and work our way right. The big, thick, white, angled, lines represent an AB/CD pattern. The calculated top of the pattern is 856.75 (see calculation on the chart), but the actual top was 874.75. This range is also shown by the large, vertical, green, downward pointing arrow.

The anticipated retracement of the green range is 50%,  61.8% or 78.6%. The box with green text on the chart has the calculations. 50% is 750.75, and 61.8% is 721.5%. Yesterday's candle low was 751, which is only a quarter point shy. You could certainly argue today's bounce was a rejection off the 50% Fib of the green range. If we say we hit the 50% Fibonacci of the green range, and price goes lower, then the next expected move is to the 61.8% Fib.

The yellow range is a possible Gartley (aka XABCD) pattern setting up. The X, A, B, and C points are labeled in white. The D point hasn't been determined yet. The shorter, thick, white, angled, lines represent the AB/CD pattern within the Gartley, and the bottom end of the line on the right is the calculated D point. You can see the calculation in the box with white text. The result is 730.5.

The candle low yesterday and today is finding support at the 61.8% Fib of the yellow range, which is 759. You could certainly argue today's bounce was a rejection off the 61.8% Fib of the yellow range. If we say we hit the 61.8% Fibonacci of the yellow range, and price goes lower, then the next expected move is to the 78.6% Fib.

The purple lines represent a Head & Shoulders pattern. You can see the traditional measured move by the purple vertical line dropping down from the neckline. But, in my experience, the better target is half the measured move. That's represented on the chart with a thin, purple, horizontal line at about 739.

The white, thick, rising, squiggly line near the bottom is the 200sma. It's currently about 721. It's rising at a rate such that it'll easily surpass 721.5 by the time price comes down to it, if price drops that far before reversing. I mention 721.5 because that's the 61.8% retracement of the green range, which is the lowest target.

Stochastics are in the bottom panel of the chart and are only barely in the oversold zone. This tells me it would not be surprising to see lower price from here.

OK, I think we hit all the elements of the chart that warrant consideration. Now I want to tie everything together. Basically, I think we're going a little lower then reversing and heading back up. Here's why:

  • The large AB/CD has an expected target of 61.8% Fibonacci retracement of the green range, which is 721.5.
  • The AB/CD of the Gartley pattern has an expected target of 730.5.
  • There's expected support at the 78.6% Fibonacci level of the yellow range at 727.643.
  • The Head & Shoulders has an expected target of 739.
  • There is expected support at the 200sma, which is currently 721 and rising.

The highest of these possible bottoms of the current down leg is 739, and the lowest is 721.5. To be conservative, I want to enter a Long position at 740, which shades the 739 level by a point to account for slippage from the Bid/Ask spread and imperfect patterns.

The proper location for a Stop on the Gartley would be just under the X point, which is 687.75. However, even with the mini-wheat futures contract at $10/pt, the risk is a little too high. The risk would be 740 - 687 = 53 points * $10/pt = $530.

To reduce the risk amount, I think we can place the Stop 710. This gives us over a 10 point cushion from the lowest expected reversal point of 721.5. The amount of the risk with this Stop would be 740 - 710 = 30 * $10/pt = $300, which is a more tolerable number.

Using the Gartley pattern to determine a Target, gives us 819.65. This is .618AD, where D is the value at AB=CD, which is 730.5. We'll have to adjust the Target when we have an actual Gartley D point.

So, bottom line is, I entered a conditional order this afternoon to buy a March Wheat mini-contract (YW) with a limit of 740, Stop 710, and Target 818. (818 shades the 819.65 exact Target to account for slippage).

Risk: 740 - 710 = 30 * $10/pt = $300
Reward: 818 - 740 = 78 * $10/pt = $780
R:R = 780/300 = 2.6:1 which is excellent. Especially when considering the Gartley has about a 75% win rate.


Wednesday, December 8, 2021

Paypal may be a friend again - Update 1


Above is a Daily chart of how we closed the day. Notice we closed above the 20sma (thick, green, curvy line). We haven't cleared it very much, and tomorrow we could reverse, but for now its looking good. We also got our ADX bullish cross and Stochastics are still low.

Given these things, and the discussion in my previous post, we're on our way to a nice trade. You can see the targets in the comment box on the chart. Our target is the .618AD3 retracement at 260.11.

Paypal may be a friend again


After a lengthy sell-off, Paypal (PYPL) may have turned the corner. The daily chart above shows how a perfectly formed Gartley pattern turned into a Butterfly. We're bouncing off the 161.8% Fibonacci extension on both the green and yellow ranges. The previous 2 candles show a Doji Gap Up candlestick pattern and a close over the 8ema. Today we see a continuation of an up swing, but the day's only half over. It also looks like the ADX DI+ is crossing over the DI-. And Stochastics is still low. All this is Bullish.

However, price is currently up against the 20sma on the Daily chart. It could easily reject off this level and head back down. So this is a critical inflection point. It'll be important to see if we cut through the 20sma and continue upward, or make new lows.

I took a flyer (high risk trade) on PYPL and got a Jan 220/230 Call spread on 11/30/21 for $0.63. It currently (12/8/21 12:53 ET) has a Bid/Ask spread of 1.08/1.18. I'll be looking to add to this position if we continue on a good trajectory.


Monday, October 18, 2021

ES Dec Short Short


You always hear "Don't fight the Fed". I agree with that, however, pull backs do occur. Just look at the 4 hour ES S&P 500 December futures chart above for proof. This post is titled "Short Short" because this trade will attempt to fight the Fed and may not last 24 hours.

Since this is a high risk trade, we want to use as small a position as possible, then scale in with more contracts later as the trade continues in our favor. So, I'm just using 1 micro ES contract with Symbol MES to start. The ES point value is $50 while the MES point value is $5.

The notes on the chart show an AB/CD pattern and a 78.6% Fibonacci retracement as 2 sources of possible coincident resistance. These can be combined by simply saying its a Gartley pattern.

In addition to the Gartley, there is also a possible Negative Stochastics Divergence.

These are sufficient to look for a reversal here, but there's more. If you look left, you'll see previous rejections of this price level on 9/27/21, 9/15/21, 9/14/21, and 9/13/21. Before that, this level acted as support on 9/9/21. Off the screenshot above, there's also resistance on 8/24/21 and 8/25/21.

I expect we may get some higher highs overnight. If so we'll have to correct the Gartley D point in the morning, which will change the Target value. But for now, the Target will be .618AD, which is 4479.75 - .618(4479.75 - 4260) = 4344. We'll use a Stop of about 20 points, specifically 4500.50.

Summary:

Enter: 4471.00
Stop: 4500.50
Initial Target: 4344.00

Risk: 4471-4500.5=29.5
Reward: 4471-4344=127
R:R = 127/29.5 = 4.3:1 which is excellent!