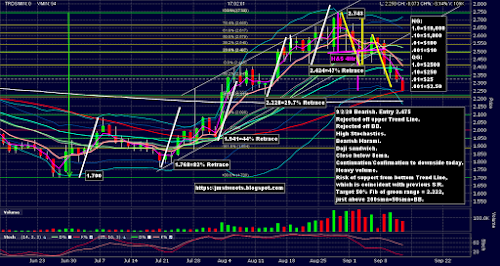
How to risk $12,000 for 9 days, do everything right, and make $25.00! That should be the title of this trade. Well, I must of done something I thought was right, but maybe it wasn't. Of course, traders can do everything right and still lose money due to the randomness in the market. So I should be happy I ended positive, right? Let's take a look at it and see if there's something to learn for the future.
First, let's discuss the exit. Yesterday I said I'd micromanage the exit in the morning. I woke up to find a consolidation channel. I waited until a likely breakout showed up around 8:30am ET. Here it is on a 10 minute chart:
You can see 2.320 would be a good Stop. Its just over the top of the consolidation. So when we got the breakout I lowered the Stop to 2.320. Well, you can probably guess what happened next:
Stop was hit 9:05:45 am ET. We covered at 2.325. I really didn't mind that much. I was glad to be out with what felt like a nice profit. We could have easily been hit at 2.410 instead, or something worse earlier in the trade.
But look at the Daily chart above. It was captured after the close. The low of the day was 2.246, landing right on the 50sma. You might remember yesterday I raised the target to 2.250. If I didn't try to optimize the exit, the exit would have optimized itself. Would have been perfect! Would have made an additional 2.325 - 2.250 = .075 x 2500/pt = $187.50.
The final net on this trade without commissions:
2.475 - 2.325 = .150 * 2500/pt = $375 core position
2.485 - 2.580 = -.095 * 2500/pt = $-237.50 second position
2.425 - 2.410 = .015 * 2500/pt = $37.50 trying to add back 2nd position but hit stop
2.365 - 2.425 = -.060 * 2500/pt = $-150 trying to add back 2nd position but hit stop
375 - 237.50 + 37.50 - 150 = $25
I went back and read all my posts in this thread looking for something to improve. Don't see anything wrong with the entry. The fact we came so close to the target supports the validity of trade setup.
One improvement I see is to check other time frames before entering the trade. I only noticed the Head & Shoulders pattern on the 4 hour chart after we had already entered the trade based on other indications. What if there was a counter-indication? Don't want to find that after entering the trade.
When price went against us in update #3, I think taking off half our position was the perfect move. In fact, price came right back down the next day, so good thing we still had our core position. We definitely would have lost ground trying to get back in. Don't see an improvement here.
Another improvement is where I put the Stop when adding back in the supplementary position. I was using the 10 minute chart to enter, so I used the 10 minute chart to set the Stop. That seemed prudent and cautious but now I think it was a mistake. I should have used the Daily chart to set a Stop like I did when we first added a supplementary position after seeing the Head & Shoulders. It means much more of a loss if its hit, but if I had done that we would have made an extra 2.425 - 2.325 = .1 * 2500/pt = $250 instead of losing $112.50.
Is micromanaging the exit on a 10 minute chart when we're close to our target a mistake? Sometimes price pulls back just shy of a target, and doesn't come back. I usually shade my targets by a couple/few points to handle a near miss as well as bid/ask spreads. I suppose there are some trades that are better left alone, but this wasn't one of them. There were many possible reversal points and an observant trader could manage that situation to a better outcome than just letting things play out on their own.
Not seeing anything else at the moment. If you see something in the managing of this trade that could be improved upon, please let me know. Meanwhile, guess this counts as a win.


No comments:
Post a Comment