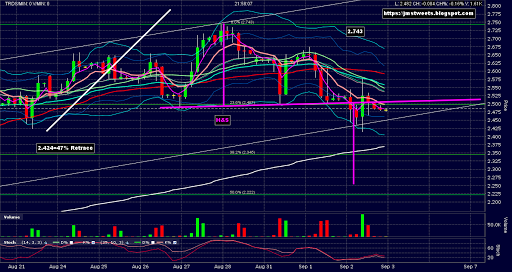
I was checking on this trade at 10:00pm ET after we entered this trade earlier today, and decided to take a look at the 4 hour chart. Check out the bonus we got! The purple lines show a beautiful, symmetrical Head and Shoulders pattern.
The vertical purple line on the right is a projection of where price is likely to go. Notice its very close to the 50% Fib target. This reinforces all the other bearish indications listed on the previous post.
So given this new bearish pattern on the 4 hour chart, I added a trade. Short from 2.485, Target 2.250 (the H&S price projection), Stop 2.685 (just above the .shoulder at 2.675).
Risk: 2.685-2.485=.200*$2500/pt=$500
Reward: 2.485-2.250=0.235*$2500/pt=$587.50
R:R=1:1.18 (not great but a Head & Shoulders is a high probability pattern, and we have a slew of other bearish indications)
The total Risk for this trade is now 562.50+500=$1062.50
The total Reward is now $625+587.50=$1212.50

No comments:
Post a Comment