Showing posts with label Shading. Show all posts

Wednesday, December 21, 2022

XLE Looks Positive

XLE Daily


The applicable part of this Daily chart, regarding this trade, begins at the 65.48 low on 7/14/22. If you draw Fibonacci levels from the recent 94.71 swing high on 11/14/22 down to the 65.48 low on 7/14/22, you'll see the current swing low at 82.65 on 12/9/22 is very close to the 38.2% Fib retracement.

Notice the price action from 94.71 to 82.65 is in a AB/CD format. See the 2 little white, downward angled, diagonal lines. And, the 82.88 swing low 2 days ago made a higher low than the 82.65 low.

Also, Stochastics, on the bottom of the chart, are extremely low at the 82.65 low.

A setup like this can lead to a substantial bounce up to the -27.2% Fib extension at 102.64. It would have been better for me to wait until the Close today to see if we close over the 8ema. Its mid-day and we are over the 8ema but I should wait a few more hours. But I'm going to be busy with other trades I have planned near the close, so I'm going to jump the gun, but use options to limit my risk to a defined amount, which is the cost of the options.

So, I got an XLE March 95 Call for 2.22. I picked March to allow enough time for the trade but also to control the Theta time decay. Also, this option has a 30% Delta, which is an inflection point in the Delta vs underlying curve, meaning Delta accelerates its increase from 30% to 70%.

The Target is the -27.2% Fib extension at 102.64. This also coincides with the price swing from 7/14/22 to 8/29/22, as represented by the thick, white, upward angled, line. The next price swing is longer, which doesn't hurt. 

I almost always shade my entries, stops, and targets to account for slippage and bid/ask spreads. So, my actual exit is when XLE is 102.50.


Monday, June 13, 2022

ZIM Zooming Down - Update 3

ZIM Daily 6/13/2022


Today we opened gap down then retraced to fill in most of the gap. But today's price action was so bearish, we headed back down before we could fill the full gap.

We ended the day with a Doji candle but near the bottom of the range. Today's low was 47.68. The previous swing low (our B point in the AB=CD) was 48.21, which means we confirmed the AB=CD pattern by surpassing the B point. This is encouraging for our trade.

But, take a look at the Stochastics panel on the bottom of the chart. It is definitely oversold now (under 20). This is a concern as it provides a kind of pressure to reverse the price action. When Stochastics are oversold, I start looking for the next likely support level. I see it as the 61.8% Fibonacci level, which also coincides with a previous swing low on 10/6/21 at 42.14. The 61.8% Fib can be calculated as:

A-.618(A-X) = 91.23-.618(91.23-11.34) = 41.86

So, I changed the target for the new July 40 Put option to 42.50, which shades the previous swing low of 42.14 to account for slippage, Bid/Ask spread, and premature buying pressure.

Given the strong momentum of the current down leg, characterized by gaps and relatively long candles, I'd expect we'll ultimately get down near our original target at 29. However, it seems likely we'll get a bounce before then. I'd rather exit and re-enter later than ride out the bounce.

Also, there is a potentially big market moving event this Wed. 6/14/22 at 14:00 ET. The FOMC rate decision. It would be great to capture profits and be out of the market before then. That's a supporting reason to raise our target.

Wednesday, June 8, 2022

ZIM Zooming Down

ZIM Daily


Shorted stock ZIM this afternoon by buying a July 55 Put for $3.20. Quarterly Earnings is 8/17/22 before the market opens. I Tweeted this out at 15:39 ET.

Here's why I'm bearish:

  • Kicker candlestick pattern
  • Blue ice failure
  • Negative Stochastics Divergence
  • Close below 8ema,200sma
  • High volume, Big bar
  • AB/CD
A Kicker pattern is when you have 2 candles separated by a gap and facing different directions (Up and Down).

Blue Ice Failure I learned from Steven Bigalow in candlestickforum.com. Its when price comes up from below the 50sma, breaks through it but can't hold it, and falls back through the 50sma. Steve uses blue for his 50sma while I use red. That's why he calls it Blue Ice Failure.

To see the NSD, look at the downward angled thick, white, line segment in the Stochastics panel at the bottom of the chart. Then see the upward thick, white, line segment on the price chart directly above. Price was heading up while Stochastics was heading down in the same time period. That's Negative Stochastics Divergence and a bearish indication.

The AB/CD pattern has not been confirmed yet because it hasn't closed below the B point at 48.21. So I did get in early but I figured it was a reasonable decision thanks to all the other bearish indications. The measured move for where to expect price to go is the D point where AB=CD, which can be calculated by D=C-(A-B)=71.40-(91.23-48.21)=28.38.

The calculated D point coincides with the 78.6% retracement at A-.786XA=91.23-.786(91.23-11.34)=28.44. So this area makes a good target.

Also, if we get to the target, then we will have set up a Gartley pattern. So the Target is a great place to reverse our position.

Summary:

Entered 6/8/2022 15:13 ET, ZIM=58.91, Bought July 55 Put for $3.20
Target 29 (which is shaded a little to account for slippage, bid/ask spread, and an early completion)
Stop is just above the Kicker at ZIM=70

Using the stock to calculate the risk:reward ratio:

Risk = 58.91 - 70 = -11.09
Reward = 58.91 - 29 = 29.91
R:R = 29.91/11.09 = 2.70 which is great.

Thursday, May 12, 2022

July Corn Possibly About To Pop

July Corn Daily

July Wheat Daily

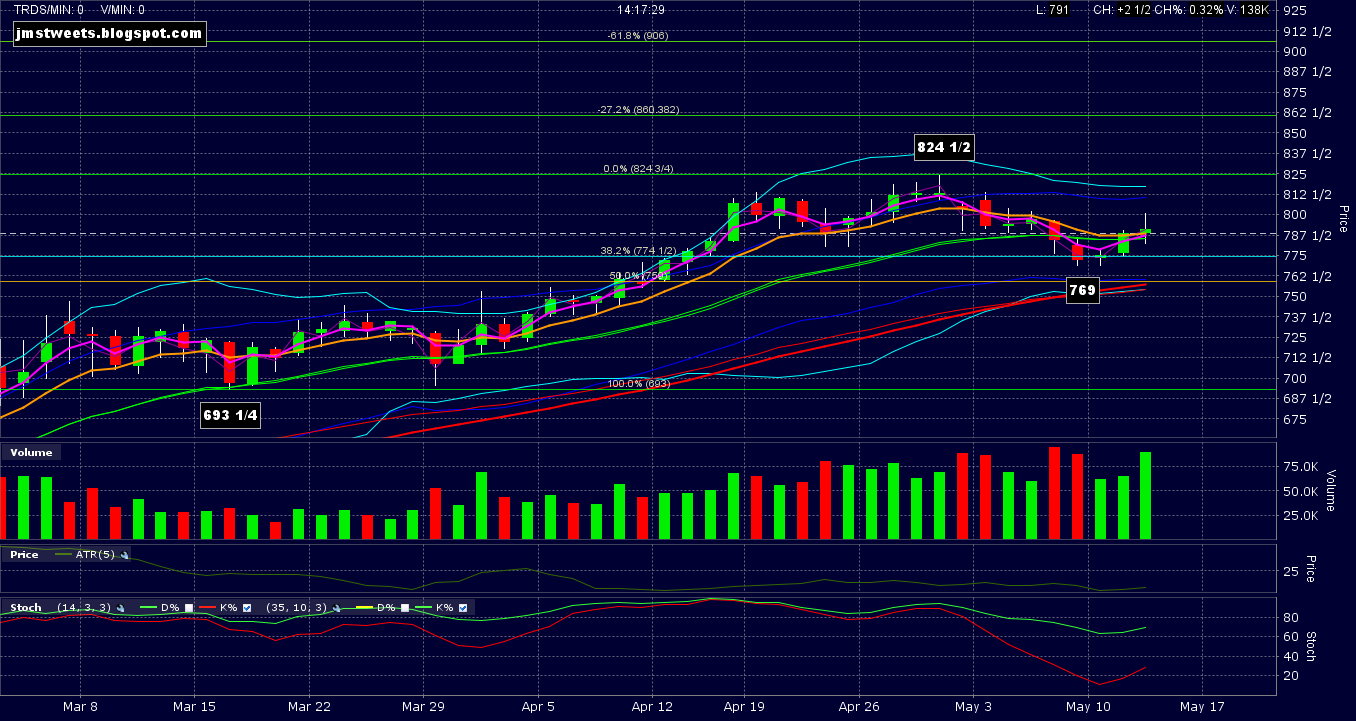
Today, 5/12/2022 at 12:00 pm ET, several grain related reports were released by the USDA. Wheat rocketed up, and this is the grain I wanted to buy, but the risk is too high for a pullback to the support level it broke through. So, I may get some wheat if it pulls back then bounces back up.

The corn market had a much more subdued reaction, yet still bullish. You can see yesterday and the day before formed a Doji Gap Up candlestick pattern, after bouncing off the 38.2% Fibonacci retracement level.You can also see Stochastics were oversold at the swing bottom. Finally, we closed over the 8ema and every other MA on my chart, on high volume.

I don't go out of my way to follow fundamentals, but the price of everything is going up in our high inflationary environment, which especially includes food and energy. Corn is used for both. This is generally bullish for corn. Then you have decreased grain exports from major supplier countries and bottlenecks in the supply chain. Also bullish for corn.

Also, the US Dollar has been screaming higher due to a flight to safety to the USD. A strong dollar should diminish prices, but corn rose today as the dollar ETF UUP made a new 2 year high.

So, based on all this bullishness, very near the market close at 14:20 ET, we bought a YC July futures contract for 794 1/2. I managed to get a Tweet out at 14:14 ET. Set a Stop at 768, just below the recent swing low, and a Target at 860, shading the 127.2% Fibonacci extension of 860.382 by just a little. We're using the YC mini-contract ($10/pt) rather than the full sized contract ($50/pt) to contain risk.

Summary:

Entry 794 1/2
Stop 768
Target 860

Risk 794 1/2 - 768 = 26 1/2 points
Reward 860 - 794 1/2 = 65 1/2 points
R:R = 65.5/26.5 = 2.5:1 which is great.

Thursday, March 10, 2022

June AUD/USD Russian Doll Gartley Patterns


This is going to be a crazy trade. I was setting up the Gartley pattern on the AUD/USD 60 minute chart above and when I was finished, I noticed there's another smaller Gartley pattern inside the first.

The bigger Gartley, let's call it the 1 hour (1h) Gartley, is still establishing its C point. I was going to wait for the D point before entering a trade. But the smaller Gartley, let's call it the 15 minute (15m) Gartley, is establishing its D point. 

The 1h Gartley has white comments and green Fibonacci's. The 15m Gartley has yellow comments and yellow Fibonacci's.

So, we can enter the 15m Gartley, but instead of using the usual .618AD Target, we can go for a bigger Target of the 1h Gartley D point. However, I want to be conservative and trade each pattern separately.

I got 2 AUD June futures using mini-contracts because the risk is 85 pips. If I used 2 full contracts I'd be risking $1,700.

I bought the 2 futures at .7372. The Stop for both is just over the X,A point at .7457. The first Target is the .618AD of the 15m Gartley. Using the current D value of .73775, the Target is:

.73775-.618(.73775-.72555)=0.7302104

The second Target is the 78.6% Fibonacci of the 1h Gartley XA leg, which is .71797. Also, using the current C point, the calculated D point is:

.73775-(.7455-.72555)=.7178, which is amazingly close to the .71797 Fib.

We'll shade the second Target a bit because on the way there, we'll encounter the .7200 level, which is a round number. You might point out we'll also be encountering the .7300 level, but that's nowhere close to the Target. Also, there is some possible support from a gap down and swing low from late February. This adds to desire to shade the second Target up to the .7200 level.

Now, here's more craziness. There's a speaking engagement in Australia by RBA Govenor Lowe at 17:15 ET, while the FX market is closed between 17:00 - 18:00. So, come 18:00 this evening, we may get a gap open but there's no telling in which direction. I could have waited until after 18:00 to enter, but I decided I can handle the risk.

Bottom Line:

Trade 1

Enter: .7372
Stop: .7457
Target: .7304
Risk: .7372 -. 7457 = -85 pips.
Reward: .7372 - .7304 = 68 pips.
R:R : 68/85 = 1:0.8 This looks bad but remember the Gartley pattern has a 75% Win Rate, which means you could have a R:R of 1:0.3 and still break even. Plus we have the 1h Gartley that may pull down price further than usual.

Trade 2

Enter: .7372
Stop: .7457
Target: .7201
Risk: .7372 - .7304 = 68 pips.
Reward: .7372 - .7201 = 171 pips.
R:R = 171/68 = 1:2.5 which is great.

Thursday, February 24, 2022

Hogs Turned Tail


Looking at the April Lean Hogs futures daily chart above, I see some Bearish indications. We should wait until we get continuation to the down side tomorrow, but I will be too busy at the Open tomorrow to be as effective as I can be today when I have time to make a considered move. So, I decided to get in short early even though I recognize this could hurt if it goes the other way.

Here are the Bearish indications I see:

  • 3 Drives to a top.
  • Bearish Engulfing candlestick pattern.
  • Close below the 8ema. 1st candle to do so since the drive began.
  • Close near candle bottom on today's and yesterday's candles.
  • High Overbought Stochastics.
  • High Volume, indicating enthusiasm.
For the Target, you could make an argument the 38.2% Fibonacci retracement would be a good place. It coincides with a Support and Resistance level. We may in fact exit at this level but judging from the Stochastics and the enthusiasm, it looks more likely we'll make it down to the 50% Fib, which also coincides with a Support and Resistance level. I drew 2 thin, white, horizontal lines to mark this S/R level. The 50% Fib is at 98.225.

So, we'll target the 50% Fib but retain the option to get out at the 38.2% Fib if conditions suggest that is a better idea when price reaches it.

Speaking of options, we entered our short position by buying an April 104 Put for 4.4250 points. The Lean Hogs market has no mini contracts and its a relatively thinly traded market that's only opened 9:30am ET to 14:05 ET. With a point value of $400/pt, we need to control our risk somehow, and Options are the only way.

The April 104 Put option cost 4.425 * $400/pt = $1,770. The underlying HE price was 105.550 at the time we bought the option. It had a Delta of 43%.

The best Stop would be just over the recent swing high at 112.850, but that's a little too much money to lose if we hit it. For example, let's say we use a Stop of 113. The loss would be approximately:

113 - 105.55 = 7.45 Points * 43% Delta = 3.2035 * $400/pt = $1,281.40.

So, instead, we're using a Stop that's just over the high of today's candle at 110. It could certainly be hit by a reasonable retrace tomorrow. A 50% retracement of today's Close (105.4) to the swing high at 112.85, would be (112.85+105.4)/2=109.125. A 61.8% retracement would be 105.4+.618(112.85-105.4)=110.0041. We used 110.500 as a Stop, which is over the 50% and 61.8% retracements, but not by much.

Our dollar risk amount is approximately:

110.50 - 105.55 = 4.95 Points * 43% Delta = 2.1285 * $400/pt = $851.40.

I say approximately because the Delta will change as price moves. If price moves against us, then the Delta should decrease a little. Which would be more than welcome. You can use the option Gamma to estimate the Delta when the underlying hits 110.50, but its not worth it in this case.

Summary:

Bought HE Apr 104 Put for 4.4250 points, when HE was 105.550.
Stop when HE is 110.50.
Target when HE is 98.325, which shades our expected target of 98.225 by .100 points for slippage.
.100 points is .1/.025 = 4 ticks in the future and .1/.0125 = 8 ticks in the option.

Risk: $851.40 from calculation above
Reward: 105.55 - 98.325 = 7.225 Points * 43% Delta = 3.10675 * $400/pt = $1,242.70
R:R = 1242.70/851.40 = 1:1.5 not a great ratio but given the uber Bearish investor environment, thanks to Russia's invasion into the Ukraine, plus the Bearish indications discussed above, I think its adequate to take the trade.


Thursday, February 10, 2022

Golden Gartley

GC Apr 2022 4hr


Annotations for this trade are in yellow on the 4 hour April 2022 Gold Futures chart above. You can see the X,A.B, and C points of the Gartley (aka XABCD) PATTERN. The first D point I chose was surpassed by higher price action. So I changed the label from 'D' to 'D1", then added the D2 point when I thought it appeared. But this was also surpassed by the D3 point, which was today.

As you might guess, I've been in this trade for a while, but I haven't posted about it. I don't include most of my trades in the blog because either they are on a short time-frame, or high risk, or I just don't have the time. I'm including this trade now because I think D3 is the final D point for this Gartley pattern.

We had an impactful CPI report this morning, 2/10/2022 at 8:30am ET, which led to a rather dynamic day in the price action. Looking back on this 4 hour chart, you can see we formed a Bearish Engulfing candlestick pattern, with a close below the 8ema, followed by a continuation candle. This is significantly more bearish than the other D points. Plus Stochastics really took a dive.

What you can't see is how close today's high came to the Stop. Here's how I entered this trade on 2/7/22:

Entry: 1814.90
Stop: 1845.00
D3 Target: 1804.60 (the D1 and D2 targets were lower and no longer of interest)

Today's high was D3 at 1843.30, just 1.70 points from the Stop. That was just luck, and I'm very grateful to be so lucky.

The current targets are shown on the chart in yellow. The actual target for this trade is 1806.00 which shades the exact target to accommodate the Bid/Ask spread, and other slippage.

OK, now we're all caught up. Let's see what happens next in this crazy market.


Tuesday, January 18, 2022

March Soybeans Formed a Bearish Gartley


Been trying to catch the D point on the Daily chart above. The first two, D1 and D2, failed but D3 led to price action breaking through the 8ema and closing below it with confirmation, which gives confidence this is the one. Its looking so weak, I decided to get in short, even though we're pretty far from the 1415 D3 point already. Even down this far, we still have a good Risk/Reward. More on the R:R later.

The proper Stop for a Gartley pattern (aka XABCD) is just above the X point, but that represents too much potential loss (Risk) if we hit it. So, we're using the recent swing high (D3) instead of the X point.

The Target is the usual .618AD, which is the 61.8% Fibonacci retracement of the A point to D point range. You can find all the Targets to consider in the box on the chart.

So, right at the Close today, I shorted a YK mini-contract at 1361 1/4.

Summary:

Entry: 1361 1/4
Stop: 1416
Target 1279 (shaded a little from D3 point to allow for slippage and the Bid/Ask spread)

Risk: 1416 - 1361.25 = 54.75 points * $10/pt = $547.50
Reward: 1361.25 - 1279 = 82.25 points * $10/pt = $822.50
R:R = 822.5/547.5 = 1.5:1 which is actually quite good if you consider the Gartley pattern has a 75% success rate at the .618AD Target.


Tuesday, January 11, 2022

High Risk March Wheat Long


Like the title says, this is a high risk trade at the time I entered it, which was at the Close today for 769. One reason its high risk is because we don't have confirmation yet, which would be a higher Close, or higher high and higher low, by the next trading day or two.

But a much greater reason for high risk is that the quarterly "Grains Stocks Report" is due out tomorrow 12:00pm ET. This can whipsaw the grains markets, and unless you hire Mr. Beeks, the reaction to the report is a craps shoot. So we do not want a position in the market at 12:00pm.


Must See Movie "Trading Places"

However, due to what I see on the Daily chart above, the odds suggest we should get some more upside, at least up to the Report release. Here's what I see (yellow box on the chart):

  • Bullish Engulfing candlestick pattern
  • Doji Sandwich candlestick pattern
  • Close over the 8ema
  • Low Stochastics
  • Tweezer Bottom candlestick pattern
  • Support from Head & Shoulders half measured move 1st Target
  • Support from AB=CD 760.50 D point
  • Support from 200sma
Since its a high risk trade, I'm using a tight Stop of 747, just under the bottom of the previous Doji candle low. Also using the YW $10/pt mini-contract.

For the Target, I'm looking at the 808 1/2 end point of a clone of the previous leg up. See the thick, forward angled, yellow lines. But I'm shading it a bit to the 50sma, which coincides with the Head & Shoulders Neckline, at about 795.

IMPORTANT: I'm setting an automatic conditional order to sell the position, no matter what, at 11:45am ET.


Friday, December 31, 2021

Feb Gold May Flutter South


At 3:28pm ET I sent this Tweet:

"Entered limit order to short Feb Gold from 1830 due to a possible bearish Butterfly pattern. Stop 1847, initial Target 1806."

See the hourly chart above for the bearish Butterfly pattern. The D point hasn't yet established itself, but the expected level is the 127.2% Fibonacci extension, which is at 1830.44.

The limit order was filled at 1830, which I shaded a little from 1830.44 to account for slippage. I set the Stop at about 5 points over the 161.8% Fibonacci extension, which is 1847. The Target is the 61.8% Fib retracement of the AD range of the Butterfly. Until we know what the actual D point is, we can't calculate the Target. But we can use an initial guess based on today's high, which is 1831.40. Based on that, the estimated Target is:

1831.40 - .618(1831.40-1789.10) = 1805.2586 ~ 1805.30

That would give us an estimated Risk:Reward of:

Risk: Stop - Entry = 1847 - 1830 = 17
Reward: Entry - Target = 1830 - 1805.30 = 24.7

R:R = 24.7/17 = 1.5:1, which is not great but its acceptable for a proven pattern like the Butterfly.

It would be very typical if price rises higher before establishing the D point. If that happens, we'll need to adjust the Target, but not the Stop because the Stop is based on the 161.8% Fib extension of the XA range (1821.60 - 1789.10), which is independent of the D point.

Summary:

Entry: 1830
Stop: 1847
Target (with estimated D point): 1805.30

R:R 1.5:1

Wednesday, December 29, 2021

March Wheat did an about-face


Above is today's Daily chart of March Wheat futures right after the grains market closed. Just before the Close I shorted a YW mini-Futures contract at 790. The mini-contract is $10/pt, while the full size contract is $50/pt.

In the previous Wheat trade on this blog I wanted to go long due to a Gartley pattern. That Bullish pattern has not yet been violated, so this is a bit of a contradictory situation. However, my Target for this Bearish trade is above the X point of the Gartley pattern, so both trades can work.

Here is what I saw that caused me to go short today right before the market Close:

  • Head & Shoulders
  • Bearish engulfing candlestick pattern
  • Continuation by the next candle
  • Close below the 8ema, 20sma, and 50sma
  • Close below the H&S Neckline
  • Possible Bollinger Band/Keltner Channel Squeeze
  • Possible AB/CD (light blue angled lines)
However, I also see we had support from a previous Support/Resistance level, and we formed a Bullish Harami candlestick pattern. Today we formed a Doji candle which represents indecision.

We could turn right around and head back up from here to hit the Gartley .618AD Target, and we haven't yet confirmed an AB/CD by dropping lower than the B point at about 750.

So, I don't have a lot of confidence in this Bearish trade yet, but there are enough indications where it makes sense to enter the trade, albeit lightly.

I set the Stop at 801. I picked 801 rather than 800 because 800 is a round number. It's just above the H&S Neckline, 8ema, 20sma, and 50sma. It's a bit of a tight Stop, but this is not yet a high probability setup. And if we break through all that resistance, then the downward momentum that got us where we are can't be very strong. So stopping out early might be a good thing.

I set the Target near the 727.643 78.6% Fibonacci level of the yellow range, which coincides with the 200sma, the measured move of the white AB/CD, and shades the light blue AB/CD and the full measured move of the Head & Shoulders.

Summary:

Entered: 790
Stop: 801
Target: 729

Risk: 801 - 790 = 11 points
Reward: 790 - 729 = 61 points
R:R = 61/11 = 1:5.5 which is ridiculously good.


Thursday, December 16, 2021

Wheat Marching to a Reversal


The Wheat March Daily chart above looks very busy but its a really cool setup and I'll explain the whole thing. I'll explain the different elements of the setup then pull everything together at the end.

Let's start on the left and work our way right. The big, thick, white, angled, lines represent an AB/CD pattern. The calculated top of the pattern is 856.75 (see calculation on the chart), but the actual top was 874.75. This range is also shown by the large, vertical, green, downward pointing arrow.

The anticipated retracement of the green range is 50%,  61.8% or 78.6%. The box with green text on the chart has the calculations. 50% is 750.75, and 61.8% is 721.5%. Yesterday's candle low was 751, which is only a quarter point shy. You could certainly argue today's bounce was a rejection off the 50% Fib of the green range. If we say we hit the 50% Fibonacci of the green range, and price goes lower, then the next expected move is to the 61.8% Fib.

The yellow range is a possible Gartley (aka XABCD) pattern setting up. The X, A, B, and C points are labeled in white. The D point hasn't been determined yet. The shorter, thick, white, angled, lines represent the AB/CD pattern within the Gartley, and the bottom end of the line on the right is the calculated D point. You can see the calculation in the box with white text. The result is 730.5.

The candle low yesterday and today is finding support at the 61.8% Fib of the yellow range, which is 759. You could certainly argue today's bounce was a rejection off the 61.8% Fib of the yellow range. If we say we hit the 61.8% Fibonacci of the yellow range, and price goes lower, then the next expected move is to the 78.6% Fib.

The purple lines represent a Head & Shoulders pattern. You can see the traditional measured move by the purple vertical line dropping down from the neckline. But, in my experience, the better target is half the measured move. That's represented on the chart with a thin, purple, horizontal line at about 739.

The white, thick, rising, squiggly line near the bottom is the 200sma. It's currently about 721. It's rising at a rate such that it'll easily surpass 721.5 by the time price comes down to it, if price drops that far before reversing. I mention 721.5 because that's the 61.8% retracement of the green range, which is the lowest target.

Stochastics are in the bottom panel of the chart and are only barely in the oversold zone. This tells me it would not be surprising to see lower price from here.

OK, I think we hit all the elements of the chart that warrant consideration. Now I want to tie everything together. Basically, I think we're going a little lower then reversing and heading back up. Here's why:

  • The large AB/CD has an expected target of 61.8% Fibonacci retracement of the green range, which is 721.5.
  • The AB/CD of the Gartley pattern has an expected target of 730.5.
  • There's expected support at the 78.6% Fibonacci level of the yellow range at 727.643.
  • The Head & Shoulders has an expected target of 739.
  • There is expected support at the 200sma, which is currently 721 and rising.

The highest of these possible bottoms of the current down leg is 739, and the lowest is 721.5. To be conservative, I want to enter a Long position at 740, which shades the 739 level by a point to account for slippage from the Bid/Ask spread and imperfect patterns.

The proper location for a Stop on the Gartley would be just under the X point, which is 687.75. However, even with the mini-wheat futures contract at $10/pt, the risk is a little too high. The risk would be 740 - 687 = 53 points * $10/pt = $530.

To reduce the risk amount, I think we can place the Stop 710. This gives us over a 10 point cushion from the lowest expected reversal point of 721.5. The amount of the risk with this Stop would be 740 - 710 = 30 * $10/pt = $300, which is a more tolerable number.

Using the Gartley pattern to determine a Target, gives us 819.65. This is .618AD, where D is the value at AB=CD, which is 730.5. We'll have to adjust the Target when we have an actual Gartley D point.

So, bottom line is, I entered a conditional order this afternoon to buy a March Wheat mini-contract (YW) with a limit of 740, Stop 710, and Target 818. (818 shades the 819.65 exact Target to account for slippage).

Risk: 740 - 710 = 30 * $10/pt = $300
Reward: 818 - 740 = 78 * $10/pt = $780
R:R = 780/300 = 2.6:1 which is excellent. Especially when considering the Gartley has about a 75% win rate.


Friday, November 5, 2021

Short Term Short Christmas Corn


On the Daily chart above, of December Corn futures, I noticed the following:

  • Completed AB/CD
  • Bearish Harami candlestick pattern
  • Bounce off Trend Line
  • High Stochastics
  • Close below 8ema & continuation

So, I entered a short position using the YC mini-contract at $10/point, rather than the ZC contract at $50/pt. 

Set the Target to the 61.8% Fibonacci retracement at 531 1/4. Actual Target will shade the mathematical Target by a little to account for slippage and Bid/Ask Spread.

Used a Stop just above the high of the second candle back, that also gives close to a 1:1 risk:reward ratio. A better Stop would be just above the previous swing high at 586, which is also coincident with the downward angled Trend Line (thin white line). But that would give a terrible risk:reward and I'm concerned we may get a bounce off the 20sma (green).

Summary:

Entered: 11/5/2021 14:15 ET at 553 1/8.
Stop: 573
Target: 532

Risk: 553 1/8 - 573 = 19 7/8
Reward: 553 1/8 - 532 = 21 1/8
R:R = 21.125/19.875 = 1:1.06 not great but acceptable.


Wednesday, September 22, 2021

Dec Wheat Bullish Gartley Re-entry


Decided its a good time to get back in long on the Dec Wheat Futures. At 13:36 ET today I sent the following Tweet:

"Back in long December Wheat Futures 13:27 ET, but I'm early. Should wait until today's close. Entry 705, Stop 685, Target 744. Details later."

So now, at the 14:20 ET close of the grains futures markets, I can see I would have made the same decision at the close as I did at 13:27, which was too early. I got in then because the chart looked like price was starting to run in front of the FOMC announcement at 14:00 ET. We were over the 8ema at the time and the risk/reward is so good that I wanted to get in before a potential pop from the FOMC news.

The chart above is a Daily chart. Just focus on the yellow annotations. It shows:

  • We closed above the 8ema.
  • We formed a Bullish Engulfing candlestick pattern.
  • We formed a higher swing low.
  • We're still in a Bullish Gartley pattern.
  • We already bounced off the Moving Average resistance above us.
    • This suggests this time we can cut through it.
Also, there are no significant wheat related USDA reports until the 9/30/21 Grain Stocks report.

The 685 Stop is just under the recent swing low. The 744 Target is the .618AD Fibonacci retracement, shaded a little bit from 744.671 to account for slippage and Bid/Ask spread.

Summary:

Entry 705
Stop 685
Target 744

Risk 685 - 705 = 20
Reward 744 - 705 = 39
R:R = 39/20 = 1.95:1 which is good.

Tuesday, August 17, 2021

Dec Wheat Looks Short


I'll admit right up front I entered this trade too early. Should have waited for a continuation downward, or even better would be a lower close. But this looks so good I couldn't resist.

What I see:

  • AB/CD completion and reversal.
  • Evening star candlestick pattern.
  • Close below 8ema.
  • High Stochastics.
  • High volume.
For targets, I like the 50% and 61.8% retracements of the yellow range. Starting out with the 61.8% Fibonacci as the target at 682 1/2. But the actual target will shade it a bit to 683 to account for Bid/Ask spread and slippage.

Placing the Stop just above the 786 1/2 swing high.

Using the YW mini contract ($10/pt) rather than the ZW full contract ($50/pt) to control risk since I'm entering too early.

If it looks like a good idea, I might add another contract this week with the 50% Fibonacci as the target.

Summary:

Entry: 748 on 8/17/21 at 14:17 ET.
Stop: 787
Target: 683

Risk: 748 - 787 = -39 * $10/pt = $390.
Reward: 748 - 683 = 65 * $10/pt = $650.
R:R = 650/390 = 1.7:1 not great but acceptable.

Monday, July 26, 2021

Fly United to Gartleyville


See the Gartley pattern on the UAL daily chart. You can see the X, A, B, C, and D points clearly marked on the chart. We also formed a Morning Star-like candlestick pattern and closed over the 8ema as well as over the 200sma. We completed the AB/CD within the XA range very close to the 78.6% Fibonacci retracement. Stochastics are mid-range. This is a Bullish set up.

A possible problem with this trade is how price gapped down on relatively high volume into the 78.6% Fib. This is an indication of high momentum to the downside, and it would be more conservative to pass on a trade with this characteristic. The risk is we don't reach our .618AD target before reversing and heading back down. If we get substantial resistance before hitting our target, we should get out early, or at least move our Stop to break even.

Another source of trouble is the possible resistance from the 20sma (green), which we closed directly on today, as well as the 50sma above (red).

Bought a UAL Aug 50 Call for $1.97 just before the market close when the stock was 49.48 and the Delta was 48%.

We'll exit if we violate the Gartley pattern by dropping below the X point at 39.17. If this happens, we'll monitor this chart for the formation of a Butterfly pattern.

Targeting the .618AD level, which is 42.56+.618(63.70-42.56)  = 55.62

Summary:

Entry 49.48 (Call option $197)
Stop 39.15 (shaded by 2 cents)
Target 55.60 (shaded by 2 cents)

By Stock:
Risk: 49.48-39.15=10.33
Reward: 55.60-49.48=6.12

By Option:
The Delta was about 50%. $10.33 stock risk * 50% = $5.17, but risk is capped at the cost of the option, which is $1.97. Reward is about 6.12 * 50% = $3.06. So, for our option position,
Risk: 1.97
Reward: 3.06
R:R = 3.06/1.97 = 1.6:1 which isn't great but hitting the 61.8% Fib as a target on a Gartley pattern is a high probability trade, at least in my experience. So this R:R is acceptable.

Tuesday, July 13, 2021

Corn Dec Hourly Inverted Head & Shoulders


Sent this Tweet 9:31am ET this morning:

"Dec Corn broke inverted Head & Shoulders this morning on USA CPI Report. We're long with first Target 547."

Here's the 9:27am ET chart I sent with the Tweet:


You can see on this chart at the market open that price had broken through and closed above the Inverted Head and Shoulders neckline. The upper, thick, yellow, vertical line is the measured move for a Head & Shoulders pattern. The thin, yellow, horizontal line is the halfway point at about 547. I have found that many more Head & Shoulder patterns reach the halfway point than the full extension. So I like to set the first target to the halfway point.

The top chart is the Daily chart and the chart underneath it is the Hourly chart. Both were captured after the close. On the Daily chart and the early morning chart you can see there was a gap down from 573 1/2 to 552 1/4 from 7/2/21 to 7/6/21 over the Independence Day holiday.

Since open gap's like to be filled, and we have an Inverted Head & Shoulders breakout, its a reasonable expectation for price to continue up into the gap.You'll also notice the I.H&S breakout is also a Frypan Bottom breakout.

The top 2 charts show price closed over the 8ema on the Hourly chart as well as on the Daily chart. On the Daily, we also had a Hammer candle on overbought Stochastics followed by a Bullish Engulfing candle.

All this suggests we have a significantly bullish set up. Even though, it is normal to briefly reverse and retest the neckline before continuing upward. We may get this tonight when the market re-opens at 8pm ET.

We entered long 8:41am ET at 537 1/2 using the YC Dec futures contract. Went long another one 9:49am at 539 1/4. Set the first target at half the I.H&S measured move at 547. Set the second target at 560, which is just under the full measured move. I think there's a good chance we'll go higher and get close to the top of the gap at 573 1/2, but I want to see what the price action looks like after the second target is hit before adding a third contract.

Today's high on my Interactive Brokers ZC chart shows as 547. Our target was 547 but the sell limit order wasn't triggered. Maybe its the difference in the Bid/Ask spread on the YC contract vs the ZC contract, but I did shade the actual target from 547 1/2 to 547, which should have taken care of a 2 tick price difference. Well, the drawing of the measured move is a bit of an inexact construction anyway, but to hit 547 on ZC and not trigger our order is quite frustrating. Bottom line is we're still long 2 contracts.

On the Hourly chart you can see we got some resistance from the 200sma. If we're going exit with a profit we'll have to get through and close over that line. But the 200sma is often a powerful support/resistance level which is respected by the price action. This means its likely we'll head back down to the neckline. Then the crucial retest will tell us if we continue back up towards our targets, or not, which would mean the halfway point of the measured move is all we get, and I've seen that happen in the past.

I set the Stop to 526 which is just below the 527 1/2 most recent swing low.

Summary:

Bought 1 YC Dec Fut 537 1/2, Stop 526, Target 547
Bought 1 YC Dec Fut 539 1/4, Stop 526, Target 560

Risk: ((537.5-526)+(539.25-526))*$10/pt=$247.50
Reward: ((547-537.5)+(560-539.25))*$10/pt=$302.50
R:R=302.50/247.50=1.2:1 Not great but acceptable on a high probability setup.


Wednesday, June 9, 2021

Russell 2000 Bear Scalp - Exit


This started as a scalp trade but the weak and slow overnight trading dragged the price action into today. So you could argue it turned into a swing trade. But scalp or swing, look at that chart!

Yesterday's post called out a target of 2326.20. The last bar on the chart shows it breaking the 2324.90 61.8% Fibonacci retracement I was shading ("shading" means putting your exit a little ahead of the target). As you've seen, if you've been following this blog, trades do not always hit their targets like this.

Net: Entry 2344.70 - Exit 2326.20 = 18.5 points x $5/pt = $92.50 win

If I used the full contract it would have been 18.5 points x $50/pt = $925