Wednesday, February 10, 2021

Short May Wheat


Corn, Soybeans, and Wheat all look weak today, but Wheat looks like the best short to me. Shorted the YW mini contract 2 minutes before the 14:20 ET close from 639 5/8. The chart above is the May Wheat Daily chart.

While this trade has some challenges, because we don't have enough confirmation, I decided to risk entering a little early based on the very Bearish setup and limit our financial risk. 

By lack of confirmation I mean we bounced off the 50% Fib on the previous up leg, as well as the 50sma, on the Daily chart, without making a lower low. We also haven't seen continuation downward by a second candle. And we may be in a sideways consolidation or wedge rather than a cascading down trend. The Bollinger Bands are still inside the Keltner Channel and Stochastics are mid-range. Because of all these challenges I decided to use the YW mini contract ($10/pt) rather than the ZW full contract ($50/pt).

By limiting our financial risk by getting in early I mean our risk is the distance from the entry to the Stop, so a higher entry is closer to the Stop than a lower entry. If we wait for confirmation we'll have a lower entry.

Here are the Bearish indications I see:

  • Dark Cloud candlestick pattern
    • 2/8/21 .5*Body=(647.75+659.5)/2=653.625
    • 2/9/21 Close=654; very close to half the body, as calculated above
    • 2/8 Hi=661, 2/9 Open=661; satisfies requirement of 2nd candle >= 1st candle high 
  • Close below 8ema
  • Possible Head & Shoulders
  • Possible AB/CD
  • Cascading lower highs after 52 wk high

Target = 604, just before the calculated D=603 1/4 (notice the 78.6% Fib is 595 3/4)
Stop = 663, just over most recent swing high 662 3/4

Risk = 663 - 639 5/8 = 23.375 * $10/pt = $233.75
Reward = 639 5/8 - 604 = 35.625 * $10/pt = $356.25
R:R = $356.25/$233.75 = 1:1.5 not great but acceptable

DBX AB/CD - Update 3


The best part of today was the open. We gapped up by 24.78(today's open) - 24.15(yesterday close) = 0.63, which is .63/24.15 = 2.6%. That's significant. Which may be why longs could have taken some profits. Of course, I don't know if either is true, but a nice gap up is certainly a Bullish indication.

We closed the day right on the 8ema and not under the 8ema. So, based on that, I don't see a good reason to exit. We'll see what happens tomorrow.


Tuesday, February 9, 2021

March Natural Gas Bearish Gartley - Update 1


Good day in favor of our short position. Today's candle combined with the past 2 days, form a 3 candle pattern called a Doji Sandwich. This is a Bearish pattern and suggests more downside.

Nothing to do but hold the short position. It hasn't been a big enough move to lower our Stop to break even yet.

DBX AB/CD - Update 2


Yesterday I wrote "Because we're at the previous swing high, it's common to find some resistance. So we may take a little dip this week and test the 8ema.". That's exactly what we saw today.

We opened a little higher this morning then dropped downward, but we closed above the 8ema. In fact, we didn't even touch it.

However, while we didn't form an official candle pattern, its similar to an Evening Star, and stochastics are high. Also, the ADX flattened out (see the middle subchart purple line). So we do have reason to be cautious. 

If we continue down and close below the 8ema, this chart will look like a Double Top may be forming. Meanwhile, we need to hold our position.

Monday, February 8, 2021

March Natural Gas Bearish Gartley


We have a Gartley Pattern that satisfies my "relaxed" set of rules. By "relaxed" I mean it may not fit a traditional strict set of rules, such as the following diagram, but I was taught by a well known trader a more relaxed set of rules that still has a success rate of 65% or so. By "success rate" I mean it hits a 61.8% retracement of the AD leg.


Because its quite possible we'll continue higher and surpass the current D point, I want to mitigate our risk by using the QG mini contract, where 1 point is $2500, as opposed to the full size NG contract where 1 point is $10,000.

I went ahead and entered a bearish trade because the current D point satisfies the AB=CD Pattern where it reached the 61.8% Fib of the green range and the nearby 27.2% Fib extension of the yellow range. Like I just said above, price could continue to rise and make a new D point at the 78.6% Fib of the green range near the 61.8% extension of the yellow range. But if we wait for that and we drop from here instead, we'll miss the whole trade.

Entered today at 2.880.
Stop just over the D point at 3.060.
Target .618AD = 3.057 - .618(3.057-2.268) = 2.569 
    (actual target is 2.575 to account for slippage and .005 minimum increment in the QG contract.)

Risk: 3.060 - 2.880 = .180 * $2500 = $450.
Reward: 2.880 - 2.575 = .305 * 2500 = $762.50
R:R = 762.50/450 = 1:1.7 which isn't great but its acceptable.

(P.S. I know the trailing 0 on a decimal is unnecessary since its implied without writing it but it shows precision of the number and it looks nice. It also matches the way price is shown on the y-axis of the chart.)

DBX AB/CD - Update 1


Today we gapped up. rose further, then came back down to fill the opening gap, and closed near yesterday's close. We also broke through the previous swing high at 25.16 but have yet to close over it.

Because we're at the previous swing high, it's common to find some resistance. So we may take a little dip this week and test the 8ema.

Certainly looking bullish enough to hold the long position. All of our bullish indications are still intact.


Friday, February 5, 2021

DBX AB/CD


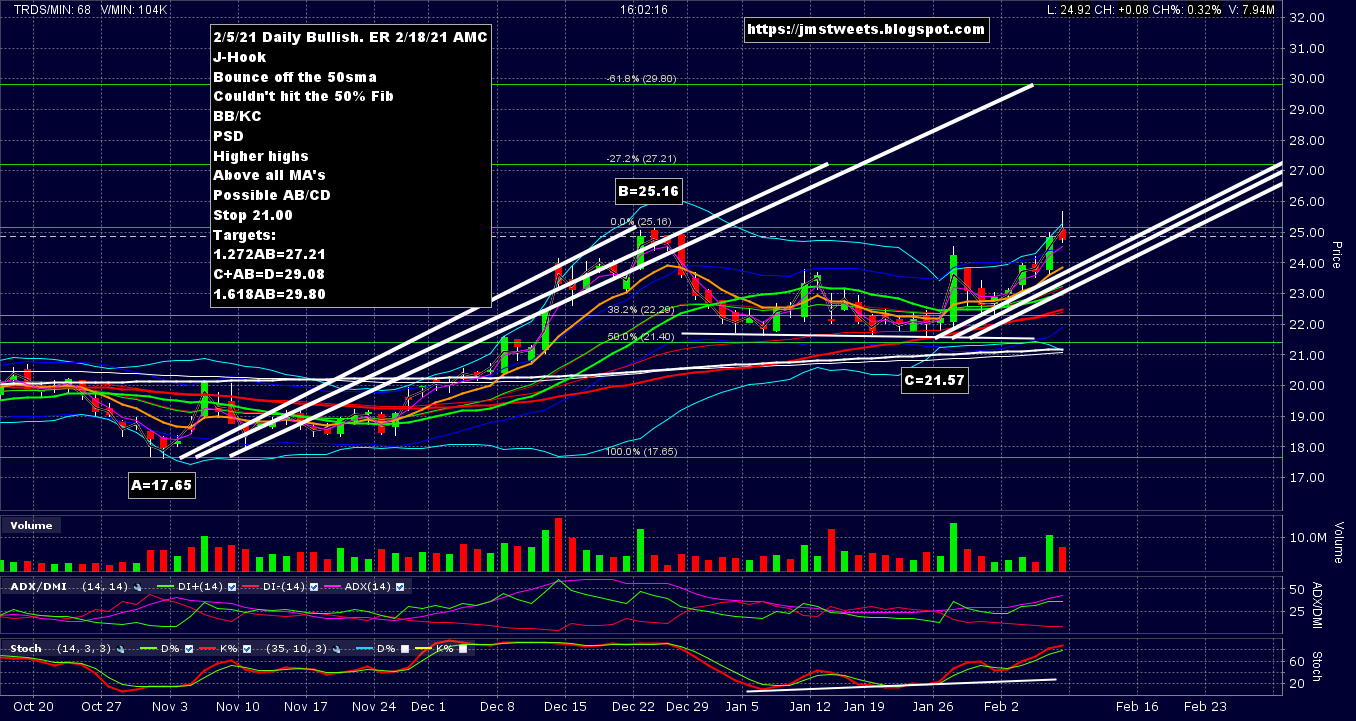
Dropbox (DBX) has its Quarterly Earnings Report in a couple weeks on 2/18/21 after market. That gives us 8 more daily candles (Equity markets are closed Mon 2/15/21 for President's Day). We only need 4 more candles of today's size to hit the D point of the AB/CD pattern.

I plan to exit before the Earnings Report even though its a Bullish chart. These reports are too much of a crap shoot without some kind of edge other than the current chart. There are strategies for trading Earnings Reports, but I only tested one of them and it didn't work. There is another one I'd like to test but haven't yet.

The top chart is a wider view of the Daily chart to include the AB/CD projections for 1:1, 1:1.272, and 1:1.618. The second chart is a close up of the Daily to see better detail of the recent price action.

I see a number of Bullish indications:

  • J-Hook candle pattern
  • Bounce off the 50sma
  • Couldn't hit the 50% Fib on AB
  • Bollinger Bands/Keltner Channel Breakout
  • Positive Stochastics Divergence
  • Higher highs
  • Above all Moving Averages
  • Possible AB/CD pattern
Got DBX Apr 25 Call at $2.96 when DBX was 24.94. I Tweeted earlier today that I was going long on DBX and posted a chart.

Stop = 21.00 just under C point.

Targets:
1.272AB=27.21
C+AB=D=29.08
1.618AB=29.80

Shooting for the 29.08 target. Using the stock price for risk/reward calculation:

Risk: 24.94-21.00=3.94
Reward: 29.08-24.94=4.14
R:R=1:1.05 no where near 1:2 but it appears to be a high probability trade.