Friday, December 31, 2021

Feb Gold May Flutter South


At 3:28pm ET I sent this Tweet:

"Entered limit order to short Feb Gold from 1830 due to a possible bearish Butterfly pattern. Stop 1847, initial Target 1806."

See the hourly chart above for the bearish Butterfly pattern. The D point hasn't yet established itself, but the expected level is the 127.2% Fibonacci extension, which is at 1830.44.

The limit order was filled at 1830, which I shaded a little from 1830.44 to account for slippage. I set the Stop at about 5 points over the 161.8% Fibonacci extension, which is 1847. The Target is the 61.8% Fib retracement of the AD range of the Butterfly. Until we know what the actual D point is, we can't calculate the Target. But we can use an initial guess based on today's high, which is 1831.40. Based on that, the estimated Target is:

1831.40 - .618(1831.40-1789.10) = 1805.2586 ~ 1805.30

That would give us an estimated Risk:Reward of:

Risk: Stop - Entry = 1847 - 1830 = 17
Reward: Entry - Target = 1830 - 1805.30 = 24.7

R:R = 24.7/17 = 1.5:1, which is not great but its acceptable for a proven pattern like the Butterfly.

It would be very typical if price rises higher before establishing the D point. If that happens, we'll need to adjust the Target, but not the Stop because the Stop is based on the 161.8% Fib extension of the XA range (1821.60 - 1789.10), which is independent of the D point.

Summary:

Entry: 1830
Stop: 1847
Target (with estimated D point): 1805.30

R:R 1.5:1

Paypal may be a friend again - Update 10


We've been just chopping around in a consolidation. We're still above the 2 Fibonacci levels that have been providing support for weeks.

There has been no news and won't be any real news until we either break out of this consolidation to the upside, as I expect we will, or to the downside.


March Wheat did an about-face - Update 2


We had a gorgeous day for our short position, even though we had relatively low volume due to it being New Year's Eve day. We closed with a lower high and a lower low than yesterday. We also closed under the previous Support/Resistance level that provided support for the past 2 candles, but not today.

And Stochastics are still in the mid-range while the BB/KC Squeeze is about to break out. Things are looking very constructive as of today's Close.

Corn also closed with bearish indications, which lends some indirect support to a short position in Wheat.

There are only 2 grain related USDA reports due out next week. They are both at 3pm ET on Monday 1/3/2022:

  • Fats & Oils: Oilseed Crushings, Production, Consumption and Stocks
  • Grain Crushings and Co-Products Production

I'm told by respected Ag trader Richard Anderson that usually neither are market moving reports. So, I'll be holding our position through the news release. You can see the schedule here:


If you noticed in yesterday's post I was also short Soybeans, I covered that position at the close today at 1340. Net is 1364 1/2 - 1340 = 24 1/5 points * $10/pt = $245 in the Soybean trade. The full contract would have been 24.5 * $50/pt = $1,225.

I closed it because:

  • I'm over-weighted short grains to hold over the weekend.
  • March Soybeans could not close below the 8ema yesterday or today.
  • Taking the profit is a hedge against Wheat gapping up at the next market open.

Nothing to do now but wait until next year :)

Thursday, December 30, 2021

March Wheat did an about-face - Update 1


We got a nice confirmation of our short thesis on the zoomed in Daily chart above. If you want to see a wider view, look at yesterday's post.

We had a little gap up at the open then formed a Bearish Engulfing candlestick pattern. Stochastics are not yet oversold, but we didn't make a lower low compared to yesterday, and the BB/KC hasn't broken out yet.

We also got some encouragement from the Corn and Soybean daily charts. (I'm also short March Soybeans as of yesterday from 1364 1/2, but I'm not blogging about it because I got in way too early.)

Our short is looking good and I held the position, but I'm not feeling confident yet. It doesn't help that tomorrow is New Year's Eve day, which makes things a little weird, including possible tax related sales by traders and expected light volume.

Wednesday, December 29, 2021

March Wheat did an about-face


Above is today's Daily chart of March Wheat futures right after the grains market closed. Just before the Close I shorted a YW mini-Futures contract at 790. The mini-contract is $10/pt, while the full size contract is $50/pt.

In the previous Wheat trade on this blog I wanted to go long due to a Gartley pattern. That Bullish pattern has not yet been violated, so this is a bit of a contradictory situation. However, my Target for this Bearish trade is above the X point of the Gartley pattern, so both trades can work.

Here is what I saw that caused me to go short today right before the market Close:

  • Head & Shoulders
  • Bearish engulfing candlestick pattern
  • Continuation by the next candle
  • Close below the 8ema, 20sma, and 50sma
  • Close below the H&S Neckline
  • Possible Bollinger Band/Keltner Channel Squeeze
  • Possible AB/CD (light blue angled lines)
However, I also see we had support from a previous Support/Resistance level, and we formed a Bullish Harami candlestick pattern. Today we formed a Doji candle which represents indecision.

We could turn right around and head back up from here to hit the Gartley .618AD Target, and we haven't yet confirmed an AB/CD by dropping lower than the B point at about 750.

So, I don't have a lot of confidence in this Bearish trade yet, but there are enough indications where it makes sense to enter the trade, albeit lightly.

I set the Stop at 801. I picked 801 rather than 800 because 800 is a round number. It's just above the H&S Neckline, 8ema, 20sma, and 50sma. It's a bit of a tight Stop, but this is not yet a high probability setup. And if we break through all that resistance, then the downward momentum that got us where we are can't be very strong. So stopping out early might be a good thing.

I set the Target near the 727.643 78.6% Fibonacci level of the yellow range, which coincides with the 200sma, the measured move of the white AB/CD, and shades the light blue AB/CD and the full measured move of the Head & Shoulders.

Summary:

Entered: 790
Stop: 801
Target: 729

Risk: 801 - 790 = 11 points
Reward: 790 - 729 = 61 points
R:R = 61/11 = 1:5.5 which is ridiculously good.


Thursday, December 23, 2021

Wheat Marching to a Reversal - Exit


Above is Yesterday's  March Wheat futures Daily chart. Yesterday, 12/22/21 at 8:47am ET, I Tweeted:

"Well, the Mar Wheat Futures setup is finally ready to trade, but the Risk:Reward is bad. So, have to pass :("

Sometimes being diligent will cost you entry to a trade. There's an old saying I like "I'd rather be out wishing I was in, than in and wishing I was out".

If I waited for confirmation and then entered, it probably would have been around 805. If I did, I would have set the Stop to 750, just below the D point at 751. The Target would be 827, which is the 61.8% Fibonacci based on a Gartley pattern with the D point at 751. You can see the targets listed on the chart.

The Risk:Reward would have been:

Risk: Entry - Stop = 805 - 750 = 55
Reward: Target - Entry = 827 - 805 = 22
R:R = 2.5:1 which is the opposite of what you want, and way to bad to trade. In addition, A risk of 55 on a mini-contract of $10/pt would be $550, which is a little too high.

So, unfortunately, I'm sitting this trade out and keeping my capital dry for the next trade.


Tuesday, December 21, 2021

Paypal may be a friend again - Update 9


More chop, but today its in our favor. We closed over the 8ema and above the 161.8% Fibonacci of the green range. We also closed at the top of today's candle.  The ADX crossed again, but at this point its useless because it keeps crossing back and forth in this chop.

It'll take 2 or 3 trading days of green candles to know if we're breaking out of this congestion. So, we're holding our bullish position and keeping our eyes open.


Wheat Marching to a Reversal - Update 1


The previous post showed we were waiting for price to get down to 740 for a long entry. We got down as low as 751, so our order never triggered.

Now, we had a bullish looking day today. We closed over the 8ema, 34ema, and 50sma. We closed over the Head and Shoulders neckline, and closed at the top of the candle. You could also argue we formed a double doji sandwich candlestick pattern, which is bullish. Also, 3 trading days ago we bounced off the 61.8% Fibonacci retracement in the yellow range. However, we haven't yet closed over the 20sma, or even penetrated it.

Do we abandon our thesis that price is coming down to the 740 area because of all the bullish indications above? I'd say not yet. I'd like to see confirmation in the form of a close over the 20sma with Stochastics not in the overbought condition. If we get this tomorrow, then we'd have to conclude we reversed the recent down trend and have entered an up leg, which would rejoin the longer term up trend.


Monday, December 20, 2021

Paypal may be a friend again - Update 8


The S&P 500, Dow Jones Industrials, Nasdaq, Russell 2000, NYSE Composite Index, Dow Jones Transportation Index, equity indexes, and probably more, all closed down over 1% today.

Look at Paypal's daily chart above. We got a Doji! That's an obvious case of relative strength. So, even though we closed 2 trading day's in a row under the 8ema, we're still in the trading range and showing outstanding relative strength, which leads me to decide to hold our position.

Friday, December 17, 2021

Paypal may be a friend again - Update 7


The last sentence of yesterday's post was "We'll want a higher high and higher low again, but what we really want is to close near the high of the day.". Well, we didn't get a higher or a higher low, but we did close near the high of the day.

We're still higher than the recent swing low at 179.15, above the 161.8% Fibonacci extension of the yellow range, and very close to the 8ema.

So, it wasn't a constructive day but it didn't break our conviction in this trade either. We're kind of chopping around down here. My expectation is that we're building a bottom from which to go much higher. But technically we're a bit at risk of heading lower.


Thursday, December 16, 2021

Paypal may be a friend again - Update 6


Today's red candle looks bad but what we see is actually still bullish. Yesterday we closed above the 8ema and the 20sma. Today we gapped up at the opening. If Stochastics were overbought, then a gap up could be an "Exhaustion Gap", and that could be bearish. But Stochastics are in the mid-range, so a gap up is bullish.

We did retrace back down to close the gap, but like I explained in a previous post in this thread, that will relieve us of any "Gap Pressure". So, it can be a good thing. Of course, we can continue down and hit our Stop, but we don't need to worry about that today.

Notice the ADX DI+ crossed back up over the DI-. That's a bullish sign. And we didn't close below the 8ema or 20sma. In fact, today's Close is sitting right on them. This could be seen as support. Which would imply we'll head back up tomorrow.

Also, notice yesterday's candle made a higher low and a higher high than the day before. And we did the same thing today. This is bullish for continuing our uptrend.

Tomorrow could be an important day for our price action. We'll want a higher high and higher low again, but what we really want is to close near the high of the day.


Wheat Marching to a Reversal


The Wheat March Daily chart above looks very busy but its a really cool setup and I'll explain the whole thing. I'll explain the different elements of the setup then pull everything together at the end.

Let's start on the left and work our way right. The big, thick, white, angled, lines represent an AB/CD pattern. The calculated top of the pattern is 856.75 (see calculation on the chart), but the actual top was 874.75. This range is also shown by the large, vertical, green, downward pointing arrow.

The anticipated retracement of the green range is 50%,  61.8% or 78.6%. The box with green text on the chart has the calculations. 50% is 750.75, and 61.8% is 721.5%. Yesterday's candle low was 751, which is only a quarter point shy. You could certainly argue today's bounce was a rejection off the 50% Fib of the green range. If we say we hit the 50% Fibonacci of the green range, and price goes lower, then the next expected move is to the 61.8% Fib.

The yellow range is a possible Gartley (aka XABCD) pattern setting up. The X, A, B, and C points are labeled in white. The D point hasn't been determined yet. The shorter, thick, white, angled, lines represent the AB/CD pattern within the Gartley, and the bottom end of the line on the right is the calculated D point. You can see the calculation in the box with white text. The result is 730.5.

The candle low yesterday and today is finding support at the 61.8% Fib of the yellow range, which is 759. You could certainly argue today's bounce was a rejection off the 61.8% Fib of the yellow range. If we say we hit the 61.8% Fibonacci of the yellow range, and price goes lower, then the next expected move is to the 78.6% Fib.

The purple lines represent a Head & Shoulders pattern. You can see the traditional measured move by the purple vertical line dropping down from the neckline. But, in my experience, the better target is half the measured move. That's represented on the chart with a thin, purple, horizontal line at about 739.

The white, thick, rising, squiggly line near the bottom is the 200sma. It's currently about 721. It's rising at a rate such that it'll easily surpass 721.5 by the time price comes down to it, if price drops that far before reversing. I mention 721.5 because that's the 61.8% retracement of the green range, which is the lowest target.

Stochastics are in the bottom panel of the chart and are only barely in the oversold zone. This tells me it would not be surprising to see lower price from here.

OK, I think we hit all the elements of the chart that warrant consideration. Now I want to tie everything together. Basically, I think we're going a little lower then reversing and heading back up. Here's why:

  • The large AB/CD has an expected target of 61.8% Fibonacci retracement of the green range, which is 721.5.
  • The AB/CD of the Gartley pattern has an expected target of 730.5.
  • There's expected support at the 78.6% Fibonacci level of the yellow range at 727.643.
  • The Head & Shoulders has an expected target of 739.
  • There is expected support at the 200sma, which is currently 721 and rising.

The highest of these possible bottoms of the current down leg is 739, and the lowest is 721.5. To be conservative, I want to enter a Long position at 740, which shades the 739 level by a point to account for slippage from the Bid/Ask spread and imperfect patterns.

The proper location for a Stop on the Gartley would be just under the X point, which is 687.75. However, even with the mini-wheat futures contract at $10/pt, the risk is a little too high. The risk would be 740 - 687 = 53 points * $10/pt = $530.

To reduce the risk amount, I think we can place the Stop 710. This gives us over a 10 point cushion from the lowest expected reversal point of 721.5. The amount of the risk with this Stop would be 740 - 710 = 30 * $10/pt = $300, which is a more tolerable number.

Using the Gartley pattern to determine a Target, gives us 819.65. This is .618AD, where D is the value at AB=CD, which is 730.5. We'll have to adjust the Target when we have an actual Gartley D point.

So, bottom line is, I entered a conditional order this afternoon to buy a March Wheat mini-contract (YW) with a limit of 740, Stop 710, and Target 818. (818 shades the 819.65 exact Target to account for slippage).

Risk: 740 - 710 = 30 * $10/pt = $300
Reward: 818 - 740 = 78 * $10/pt = $780
R:R = 780/300 = 2.6:1 which is excellent. Especially when considering the Gartley has about a 75% win rate.


Tuesday, December 14, 2021

Paypal may be a friend again - Update 5


Every equity index was down at the 16:00 ET close today. If you average out the percentages its about .5% down. Meanwhile Paypal closed about .5% up. That's Bullish relative strength.

We're still under the 8ema, and every other Moving Average on the Daily chart above, so we're not out of the woods yet. We didn't form a candlestick pattern but we did make a green candle and closed over the 161.8% Fibonacci extension on both the green and yellow ranges.

If we continue upward from here, we'll be making a higher low, which is Bullish. We could even form a Bullish Inverted Head and Shoulders pattern, but I'm getting ahead of myself.

For now, I think the best decision is to hold our Bullish position.

Monday, December 13, 2021

Paypal may be a friend again - Update 4


On today's Daily chart at the top, you can see we're still above the Butterfly D3 point, still above the 161.8% Fibonacci extensions of both the green and yellow ranges (see previous posts for a wider view of the Daily chart where you can see the ranges), formed a Doji candle which represents indecision, and closed very close to the 8ema. These are indications the current down leg has insignificant momentum.

On the Daily chart on the bottom, we zoom in to show that we closed the Gap. Now that the Gap is closed, we no longer have what I like to call "Gap Pressure", which means there's an attraction to price to reverse and fill in a gap. So now, with the gap filled, price is free to resume the uptrend.

The expectation from here is to reverse direction, go up and penetrate the 20sma (thick green curvy line). and continue up to fill the next gap, which is from 226.25 (11/8/21) - 215.97 (11/16/21). We'll probably get a temporary rejection and drop after filling that gap because in addition to the gap is the 50sma, which is currently in the gap (thick red curvy line).

After that, we can continue upward to our target of 260, which is the .618AD3 retracement.

Saturday, December 11, 2021

Stocks of Interest - Criteria

 For me to be interested in trading a particular stock, I'd look to meet the following criteria:


  • Traded on a USA exchange.
  • Not pink sheets or Over-the-counter.
  • Minimum 200,000 shares traded on a daily basis. The higher the better.
  • Either options or the stock must have a reasonable Bid/Ask spread.
  • Share price over $5.
  • Infrequent gaps.
  • Over 200 days of trading history.
  • Next quarterly earnings report at least 10 days away.
  • Optional: Longs are over the 50 DMA (Daily Simple Moving Average) and shorts are under the 50 DMA.
  • Optional: -1 > Beta < 1. The closer to 0 the better.

Friday, December 10, 2021

Paypal may be a friend again - Update 3


The daily chart above looks weak. We bounced off the 20sma, closed below the 8ema, and the ADX crossed back to a negative condition. Bearishness.

However, we just closed the gap from 12/6/21 - 12/7/21. We never went lower than the 161.8% extension of the green range. Stochastics are not overbought. And, while we did close under the 8ema, we closed very near it. Also, we haven't seen confirmation that we're going lower by the next candle, which of course is because it hasn't formed yet lol.

Given the above, its a difficult call to make, whether to hold or exit. Some doubt is introduced by suspecting I'm just avoiding taking a loss, which is a real psychological bias traders have to fight. But being a Friday, and having only a small amount of potential loss, I decided to hold the position because we wouldn't want to miss a gap up and run to the upside on Monday when we don't have a convincing case today either way.

It may seem ridiculous to do this analysis and struggle with a decision when there is so little capital at risk on this trade. But there are two things you need to consider. One is I may be documenting my trades with only a proportional fraction of my actual position. But more importantly, good trading is far more about process than outcome. There isn't anyone in the world who is saying their trading methodology has a 100% win rate. So occasional, or even frequent, losses are guaranteed, even with the best trading system you can find.

Becoming a profitable trader is about finding a system that has a positive expectancy and having the discipline to follow the rules of that system on every single trade. Making or losing money on any one trade doesn't matter. What matters is proving your system has an edge, and continually improving your execution. Follow a proven system and you'll make money over time. Process over outcome.

So, no matter how much or how little I have at risk, I analyze every trade with equal conscientiousness. Or at least that's my goal.

Thursday, December 9, 2021

Paypal may be a friend again - Update 2


Nothing changed for our bullish position today. It looks like we got a Bearish Harami candlestick pattern, but yesterday's Open was 191.95 and today's Close was 191.75, so that's not a valid pattern. Also, we closed over the 8ema.

I think we just gave some respect to the 20sma but as of today's trading, its inconsequential. So, we held our position.

Tomorrow morning at 8:30am ET we get the monthly US CPI (Consumer Price Index) report. That's rated as a High Impact report and will likely move the markets one way or another, if its not close to the expected number, which is .7% for CPI and .5% for Core CPI. 

I considered getting a hedge or even exiting the position today, before the report comes out, but decided not to because of 2 reasons:

I think its very likely to be higher than expected. If so, I'd expect that to be bullish for PYPL because in inflationary times, consumers spend their money faster since their purchasing power is eroding quickly. And it seems very unlikely we'll get a low inflation number.

If the report comes out as expected, then it will have no effect on stocks and we can follow our Technical Analysis, which says its not yet time to sell.


Wednesday, December 8, 2021

Paypal may be a friend again - Update 1


Above is a Daily chart of how we closed the day. Notice we closed above the 20sma (thick, green, curvy line). We haven't cleared it very much, and tomorrow we could reverse, but for now its looking good. We also got our ADX bullish cross and Stochastics are still low.

Given these things, and the discussion in my previous post, we're on our way to a nice trade. You can see the targets in the comment box on the chart. Our target is the .618AD3 retracement at 260.11.

Paypal may be a friend again


After a lengthy sell-off, Paypal (PYPL) may have turned the corner. The daily chart above shows how a perfectly formed Gartley pattern turned into a Butterfly. We're bouncing off the 161.8% Fibonacci extension on both the green and yellow ranges. The previous 2 candles show a Doji Gap Up candlestick pattern and a close over the 8ema. Today we see a continuation of an up swing, but the day's only half over. It also looks like the ADX DI+ is crossing over the DI-. And Stochastics is still low. All this is Bullish.

However, price is currently up against the 20sma on the Daily chart. It could easily reject off this level and head back down. So this is a critical inflection point. It'll be important to see if we cut through the 20sma and continue upward, or make new lows.

I took a flyer (high risk trade) on PYPL and got a Jan 220/230 Call spread on 11/30/21 for $0.63. It currently (12/8/21 12:53 ET) has a Bid/Ask spread of 1.08/1.18. I'll be looking to add to this position if we continue on a good trajectory.


Friday, November 26, 2021

Expecting WMT Bullish Reversal - Exit


Nov. 24th, 9:32am ET, I Tweeted "Changed my Target for Walmart to 147."

At 9:39am, 7 minutes later, the 147 target was hit. The high of the day on 11/24/21 was 147.06.

Today there was crazy market action on Covid news. The WMT high was 147.88, then dropped and closed below the 8ema.

So basically, we nailed it.

Summary:

11/17/21 Bought a December 17th 145/150 Call Spread for $0.95.
11/18/21  Bought another December 17th 145/150 Call Spread for $1.15.
11/24/21 Sold all the options at $2.23.

Profits:

223-95=128
223-115=108
128+108=$236

Tuesday, November 23, 2021

Expecting WMT Bullish Reversal - Update 5


Another good day for our bullish position. We didn't make a candlestick pattern but we did close over the 8ema. And we closed very close to the high of the day. Stochastics are mid-range, so not a factor. Volume was a tad lighter but we are nearing Thanksgiving in the USA.

The ADX DI- and DI+ are getting close to crossing. If we can close a trading day with the DI+ over the DI-, that would be a nice Bullish indication.

All in all, we still have a very Bullish looking chart.

Our next big challenge is the 20DMA (Daily Simple Moving Average). Its the thick, green, squiggly line (We currently topped out today at the 20ema.). Its very close to the 61.8% Fibonacci retracement level of the yellow range. This confluence is also coincident with a previous swing low at 147.39 on 10/27/21. And more recently, the yellow 61.8% Fib provided 3 days of support.

Because of this confluence, I'm expecting a temporary pullback from the 147-148 area. Due to that, plus this Thursday 11/25/21 starts a 4 day period of either very light volume or closed markets, I'm seriously thinking about exiting the position if price hits 147. This would lock in our current profits in a very sketchy market environment, and we can always get back in.


Monday, November 22, 2021

Expecting WMT Bullish Reversal - Update 4


'Twas a good day for our bullish position. We got a larger than usual candle, based on the passed several days. And we got it on higher volume than the past 2 trading days.

We came very close to closing over the 8ema but price pulled back near the close. Still, we closed very near the high of the day, and above the 50 DMA (Daily Simple Moving Average).

Stochastics are up off the bottom now, but still quite low. So we have a long way to go before worrying about being overbought.

All of the above are bullish, but we did not make a valid candlestick pattern today. That plus the fact we couldn't close above the 8ema is a concern. But I'd say the Bulls definitely won the day. We should definitely hold our position.

I added the thick, white, angled lines to the chart to show the possible AB=CD target.


Saturday, November 20, 2021

Expecting WMT Bullish Reversal - Update 3


Normally I include targets in my posts but I haven't yet on this one. I'm really not sure yet but I do see some possible targets. Here they are in ascending order:

  • 145.11) 38.2% Fib of the yellow range.
  • 146.43) 50% Fib of the yellow range.
  • 147.74) 61.8% Fib of the yellow range.
  • 149.61) 78.6% Fib of the yellow range.
  • 151.90) Trend line.
  • 155.03) 127.2% Fib of the yellow range.
  • 156.71) 127.2% Fib of the green range.
  • 158.16) AB=CD 140.86+(152.00-134.70)
  • 158.88) 161.8% Fib of the yellow range.
  • 162.69) 161.8% Fib of the green range.

Of course, none of these are guaranteed. We could start tanking on Monday. But if I hazard a guess now, I'd say the confluence of the AB=CD at 158.16 and the 161.8% Fib at 158.88 looks good.

In addition to the confluence, if price is making a swing low here, then we're reversing in the middle of the channel we're in rather than the bottom of the channel. That would be Bullish.

Also, Stochastics are still oversold. So we have a long runway to the upside based on that. And, it has a slight upward slope over the past couple days. In fact, you'll notice while the Stochastics are sloping upward the past couple days, the candle lows are sloped downwards. That's a Positive Stochastics Divergence, which is very Bullish.

And on a fundamental basis, which I try to ignore, Walmart's quarterly Earnings Report on 11/16/21 was considered very good and analysts were surprised the stock went down. I'd guess it was a Wall Street manipulation to fill the gap. Also, I think the strong inflation we obviously have will increase traffic to Walmart for quite some time. If these fundamental reasons are true, they'll provide a tailwind to Walmart's stock.

But, I'm not confident at all about a target at this point, just an opinion we're heading higher based on technical analysis. This being the case, I picked a price range for a Vertical Call Spread that I thought would be within the up leg I think we're starting, and had an expiration date that gives us enough time for the price action to reach its swing high, far enough in the future to limit the Theta time decay, yet not so far as to limit the Gamma. As you know from the original post in this thread, I picked the December 145/150 for about $1.00 each.

Soon as I bought the options, I entered an order to sell them at $4.95, which represents the maximum valuation of the spread other than holding to expiration. 

So, the bottom line is we don't need an exact target on this particular trade, at least the way I'm trading it. We just need WMT to rise high enough over 150 such that the option spread reaches a valuation of $4.95.

Friday, November 19, 2021

Expecting WMT Bullish Reversal - Update 2


Today's Daily chart is actually more interesting than it looks. First thing to notice is we opened gapped up. If Stochastics were high, this might be considered an Exhaustion Gap, which would be Bearish. However, Stochastics are still oversold, which gives a Bullish connotation to the gap up, because it shows enthusiastic buying at this price level.

Then you notice the candle went down and closed near its low, forming a Dark Cloud Cover candlestick pattern. This is a Bearish pattern, however given the oversold condition, the pattern's importance is greatly diminished.

Filling the gap that we made this morning is a good thing, in my opinion. Why?  Conventional wisdom says all gaps get filled, sooner or later. If you look at any heavily traded security, you'll see its true to a large extent. So, when a gap is made, and left open as price action continues away from it, I imagine there's a "gap fill pressure" that can slow down and reverse the price action to come back and fill the gap. That's just a fictitious mental construct on my part, but it adds a factor to my decision making. My point is that we won't have any "gap fill pressure" going forward since we immediately filled that gap today. 

Another thing to notice is we bounced off the 50 DMA (Daily Simple Moving Average). Looking backwards on the chart you can see WMT doesn't give the 50 DMA much respect, so I wouldn't give this much weight.

Also, today's candle body stayed within the 143.66 - 142.01 gap from Oct. 19th. This suggests to me that the fact we formed a down candle and a Dark Cloud Cover pattern may not be significant.

Finally, notice we didn't go below the bottom of our 3 supports and didn't make a new swing low. This is Bullish.

So, given all of the above, plus we're in a Bullish season of the year, and we have a Full Moon tonight (there is much research, including my own, that shows a high correlation between Full and New moons and the equity indexes), leads me to hold our Bullish position over the weekend.

Thursday, November 18, 2021

Expecting WMT Bullish Reversal - Update 1


We hit and reversed off of all 3 support levels I called out yesterday. Doesn't mean we won't plummet to new lows tomorrow, but I think the odds are for more upside.

Yesterday's WMT open was 143.16. Today's close is also 143.16. That means today's green candle body on the Daily chart above fits within yesterday's red candle body. That means we formed a Bullish Harami candlestick pattern.

So, I Tweeted today at 15:52 ET that I got another WMT Dec 145/150 Call Spread for $1.15. 


Wednesday, November 17, 2021

Expecting WMT Bullish Reversal


Expecting Walmart (WMT) stock to do a Bullish reversal due to multiple coincident sources of support:

  • .618 Fibonacci at 141.32
  • Gap fill at 142.01
  • 200sma 141.32
  • All the above are with oversold Stochastics
So I got a December 17th 145/150 Call Spread for $0.95. Assuming full value at exit, the vertical option spread will worth close to $5.

So the Risk:Reward is about 5/.95 = R:R = 1:5, which is fantastic.

I expect to add more spreads when the price action shows the reversal has begun.

Friday, November 12, 2021

Christmas Wheat Reversing on Ag News - Exit


This morning 7:26am ET I Tweeted that I exited the trade at 810 1/8 based on an Inverted Scoop pattern on the 5 minute chart. See the top chart above. As you know from the other posts in this thread, I was looking to get out today by the Close due to a wheat related report that was scheduled for release after the grains market closed.

In the morning, price was heading down and looking serious about it. I was watching the paper profits dwindling away, not knowing or having any indication whether we would continue down all day. So I went down to the 5 minute chart and watched for a pattern or some indication about where the market was headed for the rest of the day.

Then I saw an Inverted Scoop pattern develop and trigger to the down side. See the red oval on the top chart above. So, the most reasonable thing to do was exit before more damage was done.

Of course, after the 9:30am ET Open, price started back up and hit a high of 826 3/4, which is about 5 points away from our Target of 832. See the bottom Daily chart above. That Target may well be hit the first day of trading next week. I thought about chasing wheat back up today, but that could have turned out badly and erased the profit we already realized. I decided to go trade other things.

All in all, can't complain about this trade. Price behaved exactly as anticipated overall and we made a good profit. Of course, I wish price had moved a little faster and there was no Ag report today. But a perfect trade is rare.

Summary:

Entry: 780 5/8, 11/9/21
Exit: 810 1/8, 11/12/21
Profit: 810 1/8 - 780 5/8 = 29.5 points * $10/pt = $295.

If we used the full size contract, profit would have been 29.5 * $50/pt = $1,475.

Thursday, November 11, 2021

Christmas Wheat Reversing on Ag News - Update 2


Another good day for our long position. In fact, today's high was 824 3/4, which is getting close to our target of 832.

At 10:03am ET this morning, I Tweeted that we moved our Stop to break even at 782. We're at a point now, that if we fall that far, something is curiously wrong, and we'll probably want to be out of this trade.

Today's high was stretched out pretty far from the 8ema, and even from the 3ema. That, plus possible resistance from the 127.2% Fibonacci extension of the yellow range, made the pull back to about the halfway point of today's candle, unsurprising. 

We got a nice volume spike today after yesterday's increase in volume, which may indicate Dec Wheat is getting increasing attention. If the attention is coming predominantly from Bulls, then that's a good thing. The fact we closed in the middle of today's candle tells us the Bears aren't yet dominating, and this uptrend is most likely not yet over.

As I mentioned in yesterday's post, I want to be out of this trade before the close tomorrow at 14:20. So, I entered a conditional order to sell our position at 14:14:14 tomorrow, Friday (just having some fun with the time). It would be preferable if we exit due to hitting our target rather than timing out. If we get another  green candle of today's size, or yesterday's size, or even Tuesday's size, we'll hit our target. That's the goal.

Wednesday, November 10, 2021

Christmas Wheat Reversing on Ag News - Update 1


Great day in the wheat fields. We created a bigger candle than yesterday on higher volume with a close very close to the high of the day.

When looking at the chart, please focus on the green annotations and the yellow Fibonacci range on the right side of the chart.

Stochastics are not yet overbought, so no pressure there. We gapped up on the open but filled the gap in, so no pressure to fill the gap.

If we exceed the previous swing high at 807, then we may attract break out and momentum traders, which will add a tail wind to our long position.

I thought about moving our Stop to break even but it would be too close to the 8ema, and our original Stop. I'd hate to have a temporary pull back overnight, hit break even, then take off to the upside. Its happened to me plenty of times in the past. So I didn't move the Stop yet.

I'm concerned about a possible rejection off the previous swing high at 807, which could create a Double Top. But, judging from the strength we're seeing, I think the odds are that we'll breach the 807 level with a mild to no reaction, then continue for a higher close on the day tomorrow.

There's a monthly report named "Wheat Outlook: November 2021" due out this Friday 11/12/21 at 15:00 ET. I don't have any intelligence on how likely this report is to move the market, so I'm thinking I want to exit this position by Friday's 14:20 close. This would avoid the risk of the report as well as weekend risk.

Bottom line; we're looking good at the moment.

Tuesday, November 9, 2021

Christmas Wheat Reversing on Ag News


Agricultural reports today were bullish for wheat. By the end of the day for grain futures, 14:20 ET, I observed the forming of a Morning Star candlestick pattern and a close over the 8ema. This was on substantial volume in a general up trend. 

When looking at the chart, focus on the green annotations and the yellow Fibonacci range on the right side of the chart.

I see 3 good candidates for targets:

  • Confluence of the 27.2% Fibonacci of the green range (832.59) and the 161.8% extension of the yellow range (834.5). 
  • AB=CD (856.75)
  • 61.8% Fibonacci extension of the green range (865.25).

Starting with the most conservative target of 832. Using a Stop just under the swing low we just made. Specifically 761.

Summary:

Entry: 780 5/8
Stop: 761
Target: 832

Risk: 761 - 780 5/8 = -19.625
Reward: 832 - 780 5/8 = 51.375
R:R = 51.375/19.625 = 1:2.6, which is great.


Short Term Short Christmas Corn - Exit


Didn't expect "Short Term" in the title to be this short. There were Agricultural Reports that came out today that referenced the grains.


Unfortunately for our trade, they came in bullish. You can see on the Daily chart above price started upward, but finally settled down under the 8ema. Technically, since we closed under the 8ema, we should have held the position. But we're also bouncing off the 20sma.

Bottom line is I lost confidence in this trade, and remembering the old adage "I'd rather be out wishing I was in, than in and wishing I was out", I just looked for the exit.

Net:

Entered: 553 1/8
Exit: 554 3/8
Loss: 553 1/8 - 554 3/8 = -1.25 * $10/pt = -$12.50

P.S. At the market close, wheat was looking strong, so I went long. See next post.


Friday, November 5, 2021

Short Term Short Christmas Corn


On the Daily chart above, of December Corn futures, I noticed the following:

  • Completed AB/CD
  • Bearish Harami candlestick pattern
  • Bounce off Trend Line
  • High Stochastics
  • Close below 8ema & continuation

So, I entered a short position using the YC mini-contract at $10/point, rather than the ZC contract at $50/pt. 

Set the Target to the 61.8% Fibonacci retracement at 531 1/4. Actual Target will shade the mathematical Target by a little to account for slippage and Bid/Ask Spread.

Used a Stop just above the high of the second candle back, that also gives close to a 1:1 risk:reward ratio. A better Stop would be just above the previous swing high at 586, which is also coincident with the downward angled Trend Line (thin white line). But that would give a terrible risk:reward and I'm concerned we may get a bounce off the 20sma (green).

Summary:

Entered: 11/5/2021 14:15 ET at 553 1/8.
Stop: 573
Target: 532

Risk: 553 1/8 - 573 = 19 7/8
Reward: 553 1/8 - 532 = 21 1/8
R:R = 21.125/19.875 = 1:1.06 not great but acceptable.


Friday, October 22, 2021

ES Dec Short Short - Exit

The original post referred to this trade as a "high risk trade". Next time I write that phrase, hopefully it will be a red flag to change my mind and not take the trade. But that didn't work this time.

The Stop was hit 10/19/21 6:54am ET at 4501.

Summary:

Entry 4471.00 10/18/21 14:40 ET.
Exit 4501.00 10/19/21 06:54.
Loss 4471 - 4501 = 30 * $5/pt = -$150.


Monday, October 18, 2021

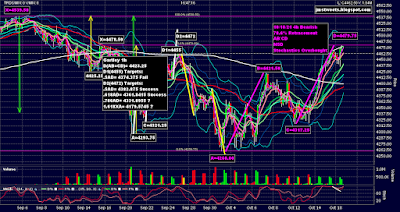
ES Dec Short Short


You always hear "Don't fight the Fed". I agree with that, however, pull backs do occur. Just look at the 4 hour ES S&P 500 December futures chart above for proof. This post is titled "Short Short" because this trade will attempt to fight the Fed and may not last 24 hours.

Since this is a high risk trade, we want to use as small a position as possible, then scale in with more contracts later as the trade continues in our favor. So, I'm just using 1 micro ES contract with Symbol MES to start. The ES point value is $50 while the MES point value is $5.

The notes on the chart show an AB/CD pattern and a 78.6% Fibonacci retracement as 2 sources of possible coincident resistance. These can be combined by simply saying its a Gartley pattern.

In addition to the Gartley, there is also a possible Negative Stochastics Divergence.

These are sufficient to look for a reversal here, but there's more. If you look left, you'll see previous rejections of this price level on 9/27/21, 9/15/21, 9/14/21, and 9/13/21. Before that, this level acted as support on 9/9/21. Off the screenshot above, there's also resistance on 8/24/21 and 8/25/21.

I expect we may get some higher highs overnight. If so we'll have to correct the Gartley D point in the morning, which will change the Target value. But for now, the Target will be .618AD, which is 4479.75 - .618(4479.75 - 4260) = 4344. We'll use a Stop of about 20 points, specifically 4500.50.

Summary:

Enter: 4471.00
Stop: 4500.50
Initial Target: 4344.00

Risk: 4471-4500.5=29.5
Reward: 4471-4344=127
R:R = 127/29.5 = 4.3:1 which is excellent!

Friday, October 1, 2021

Dec Wheat Bullish Gartley Re-entry - Exit


Target hit! I posted yesterday "My expectation though, is to cut right through it." with regard to the previous consolidation level. This was because we already bounced off it once and came right back, plus we were looking strong after the Ag report came out yesterday. Well, take a look at the Daily chart above. Please just focus on the yellow annotations, and of course, the candles. I think that qualifies as "cutting right through it".

So we hit our 744 target and then some, and its currently only 12:12pm ET as I write this. There's enough time to continue up to the 763 .786AD secondary target, but I'm not trading that one. These Gartley patterns are terrific!

Summary:

Entry 725 3/4
Exit 744
Profit 744 - 725 3/4 = 18 1/4 * $10/pt = $182.50 
If we used the ZW full sized contract: Profit 744 - 725 3/4 = 18 1/4 * $50/pt = $912.50

We've had 3 actual trades within this Gartley pattern since this thread began. Here is the net:

9/20/21 -$120
9/24/21 +$183.75
10/1/21 +$182.50
Net +$246.25 profit. 
If we used the full sized ZW contract it would have been $246.25 * 5 = +$1,231.25

Thursday, September 30, 2021

Dec Wheat Bullish Gartley Re-entry - Update 3


Today we got the "Grain Stocks" report. I discussed this in the previous post and a Tweet I sent out this morning at 8:47am ET:

"Big Grains report named "Grain Stocks" coming out 12:00pm ET. Could move ZC_F Corn, ZS_F  Soybeans, ZW_F Wheat markets. Be careful."

Now that we can see the report had a bullish effect on Wheat, we got back in right before the market close at 14:20 ET. Got a YW Futures mini-contract for 725 3/4.

See the Daily chart above. Again, I apologize for how busy the chart is. Just focus on the yellow annotations.

Notice we have a good size green bar on high volume. Had a little bit if a "Doji gap up" and a kind of a Morning Star pattern, but neither pattern is very well formed. We closed above all Moving Averages and made a new high since the D point swing low. The Bollinger Bands and Keltner Channel are beginning to blossom outward. Stochastics are still innocuous in the mid-range. All this is constructive for completion of our Bullish Gartley pattern. I consider completion to be the .618AD point.

However, you can see today's high is right on the double parallel thin white lines, which represented a gap on a much older trade on a much lower time-frame. But now it also represents the heart of the multi-week congestion. This could cause us trouble by providing some resistance. My expectation though, is to cut right through it.

Continuing with our original target of 744 at the Gartley .618AD retracement on the Daily chart. Using a Stop just under today's Open of 711 1/4, at 710.

Summary of our 3rd trade in this daily Gartley pattern:

Entry: 725 3/4
Stop: 710
Target: 744

Risk: 725 3/4 - 710 = 15 3/4
Reward: 744 - 725 3/4 = 18 1/4
R:R = 18.25/15.75 = 1.16:1, not good but acceptable for this high probability setup.

Saturday, September 25, 2021

Time-frames of Choice

This applies to technical trading in "normal" market periods. A common question I hear, and ask it myself when learning a new pattern or other setup, is "what time-frames does this work best in?". This is a fair question and if you don't get a helpful answer, here are my thoughts about picking a time-frame in general.

Too long and you increase your risk of cycles unrelated to your pattern and headline news.

Too short and you increase your risk of market manipulation and large orders. Relatively large orders would look like headline news and be easier to occur due to lower volume in short time-frames. A larger time-frame can swallow up and absorb the relatively larger orders.

So, its reasonable to think there's a medium term sweet spot. For me, its somewhere between scalping and swing trading. Specifically, I try to stay within a range of 3 minute to daily charts. My favorite time-frames are 15 minutes and 1 hour. An exception is the grains market, i.e. corn, wheat, and soybeans. I prefer the Daily chart for the grains market.

Sometimes a setup is on a time-frame where the proper Stop placement represents too large a financial risk. If you can't get that down through mini-contracts, position sizing, or options, then go to a lower time-frame to find another good, but closer, Stop placement that gives you a smaller financial risk.

Whatever time-frame you choose, be cognizant of scheduled news, such as earnings reports for stocks and agricultural (crops and livestock) or inventory (energy) reports for related commodities. Unless you have inside information, you have to prepare for a surprise, which means taking a hedge or exiting your trade.

Friday, September 24, 2021

Dec Wheat Bullish Gartley Re-entry - Update 2


Decided to exit the position for the weekend, and capture some profits while avoiding headline risk in a volatile market.

I suspect we'll get a pull back before hitting our target at 744. We're completing an AB/CD pattern, which is expected to offer some resistance. The precise D point is 728 3/4 with the calculation shown on the chart. In addition, a little higher than that, there's a swing high at 733 1/4 (see the thin white parallel lines) which also offer resistance. That swing high is right in the middle of substantial congestion in the recent past  (again, see the thin white parallel lines).

If we got a pull back early next week, it'll be problematic because there's a market sensitive Ag report due out Thu 9/30/21 named the "Grain Stocks" report. We'd want to be out of the market before that report hits. We may be significantly lower than where we are now if we get a pull back before the report.
(https://usda.library.cornell.edu/concern/publications/xg94hp534)

So, I think the best strategy is to take our profits, avoid any bearish news over the weekend when the markets are closed, wait for a pull back due to the resistance I described, then get back in after the Ag report for the ride back up to our target. We already did exit and re-enter once, which turned out to be a good decision.

The chart is still quite Bullish. We made a higher low and a higher high then closed over the 50sma, which was a possible source of resistance, but wasn't. Stochastics are still mid-range, so no pressure from being overbought. Today had higher volume than the past two days. Given a chance to get back in this Gartley pattern with a good entry, I certainly would.

Summary for this part of the trade:

Enter 705
Exit 723 3/8
Profit $183.75

Thursday, September 23, 2021

Dec Wheat Bullish Gartley Re-entry - Update 1


The Daily chart above shows we gapped up at the open last night, then filled in the gap, followed by a nice up day. Sorry its so busy. Please just pay attention to the yellow annotations.

We finished at the top of the candle, and made a higher high than the previous swing high. We closed over the 8ema and also over the 20sma and 34ema. Stochastics are still mid-range, so plenty of runway. Volume was higher today than yesterday, which adds credibility to today's move. All is is Bullish.

I wanted to add to my position but we're up against the 50sma which can provide resistance. So I'm going to wait on that. Tomorrow is a Friday so I probably won't increase the position tomorrow either.


Wednesday, September 22, 2021

Dec Wheat Bullish Gartley Re-entry


Decided its a good time to get back in long on the Dec Wheat Futures. At 13:36 ET today I sent the following Tweet:

"Back in long December Wheat Futures 13:27 ET, but I'm early. Should wait until today's close. Entry 705, Stop 685, Target 744. Details later."

So now, at the 14:20 ET close of the grains futures markets, I can see I would have made the same decision at the close as I did at 13:27, which was too early. I got in then because the chart looked like price was starting to run in front of the FOMC announcement at 14:00 ET. We were over the 8ema at the time and the risk/reward is so good that I wanted to get in before a potential pop from the FOMC news.

The chart above is a Daily chart. Just focus on the yellow annotations. It shows:

  • We closed above the 8ema.
  • We formed a Bullish Engulfing candlestick pattern.
  • We formed a higher swing low.
  • We're still in a Bullish Gartley pattern.
  • We already bounced off the Moving Average resistance above us.
    • This suggests this time we can cut through it.
Also, there are no significant wheat related USDA reports until the 9/30/21 Grain Stocks report.

The 685 Stop is just under the recent swing low. The 744 Target is the .618AD Fibonacci retracement, shaded a little bit from 744.671 to account for slippage and Bid/Ask spread.

Summary:

Entry 705
Stop 685
Target 744

Risk 685 - 705 = 20
Reward 744 - 705 = 39
R:R = 39/20 = 1.95:1 which is good.

Monday, September 20, 2021

Dec Wheat Bullish Gartley - Exit


I sent the following Tweet 14:17 ET "Selling our long December Wheat Futures position. Details later.".

Why? We rejected off the resistance level comprised of the 3ema, 8ema, 20sma, 34ema, and 50sma. Then, today, we closed under the 8ema, and most markets were down significantly, including corn, soybeans, and soybean products.

It looks like a risk off/fear trade and people are selling whatever they can. While I'm a believer in the Gartley pattern, we have to recognize it doesn't hit its target all the time. My work and research shows a high win rate, approximately 75%. I'm still working on calculating statistics on my own Gartley trades this year, but it looks like it'll be in that range.

Given the roll over look of the past 4 days on the daily chart above, combined with everything else I said, the smartest thing to do is exit our long position today and monitor the market for a good re-entry point.

Summary:

Entry 712 5/8
Exit 700 5/8
Net 700 5/8 - 712 5/8 = -12 * $10/pt = -$120.00 loss.


Friday, September 17, 2021

Dec Wheat Bullish Gartley - Update 1


Interesting challenge at the close today to decide whether to exit or hold. 

Today is a Friday, so we have weekend risk. Today and the last 2 days formed a bit of an Evening Star, but its not fully formed. Yesterday and today did form a Bearish Left/Right Combo candlestick pattern.

On the other hand, we didn't close under the 8ema, and Stochastics are not overbought. Today is a little unusual anyway being options and futures expiration day. Also relatively weak volume today. 

I think the most pertinent condition on the daily chart is a "Bobble", which means price is temporarily trapped between a set of moving averages. You can see on the chart, price is bouncing within the range of the 3ema, 8ema, 20sma, 34ema, and 50 sma.

So, given all the above, plus the fact we are using the mini-contract, I decided to hold the position over the weekend.

Wednesday, September 15, 2021

Dec Wheat Bullish Gartley


That chart is a mess but it works for me. Just look at the yellow annotations for this trade. If you know the Gartley pattern, you should easily see the XABCD vertices in yellow. The targets are in the box with yellow text. For this trade, we're going for the .618AD Fibonacci retracement to the upside.

The chart above is a 4 hour chart. Entered based on a close above the 8ema on the Daily chart, which happened today. Using the YW mini-contract ($10/pt) vs the ZW full contract ($50/pt) to control risk.

Entry: 712 5/8
Stop: 676 1/2
Target: 744

Risk: 712 5/8 - 676 1/2 = 36 1/8
Reward: 744 - 712 5/8 = 31 3/8

R:R = 1.15:1 Not good, but I have found Gartley patterns to have about a 75% success rate. I say "about" because I'm still working on my statistics on my first 200 trades, but I can see it'll be close to 75% or even better. If you have a R:R = 1:1 and a success rate of 75%, you'll have a positive expectancy.

Thursday, August 26, 2021

Fly United to Gartleyville - Exit


Technically, since we closed above the 8ema and the 3ema, and Stochastics are not overbought, we should remain in this trade. 

However, I looked back at previous gaps (see the yellow arrows on the Daily chart above) and every one was filled in. Given that, and we have a big gap right below us 2 days ago, plus a red body today, caught between the trend lines, headline risk tomorrow from the Federal Reserve Chairman speaking at Jackson Hole, bad things happening in Afghanistan, and tomorrow being a Friday, this is beginning to smell like a high risk trade at the moment.

It seems best to let things settle a bit, or react strongly, until early next week. So, sold the UAL Sep 50 Call for $0.80. Sent a Tweet out at 15:49 ET announcing our exit.

We'll keep an eye on UAL and get back in on the Gartley when the timing is better.

Summary:

Enter $101
Exit $80
Loss $21